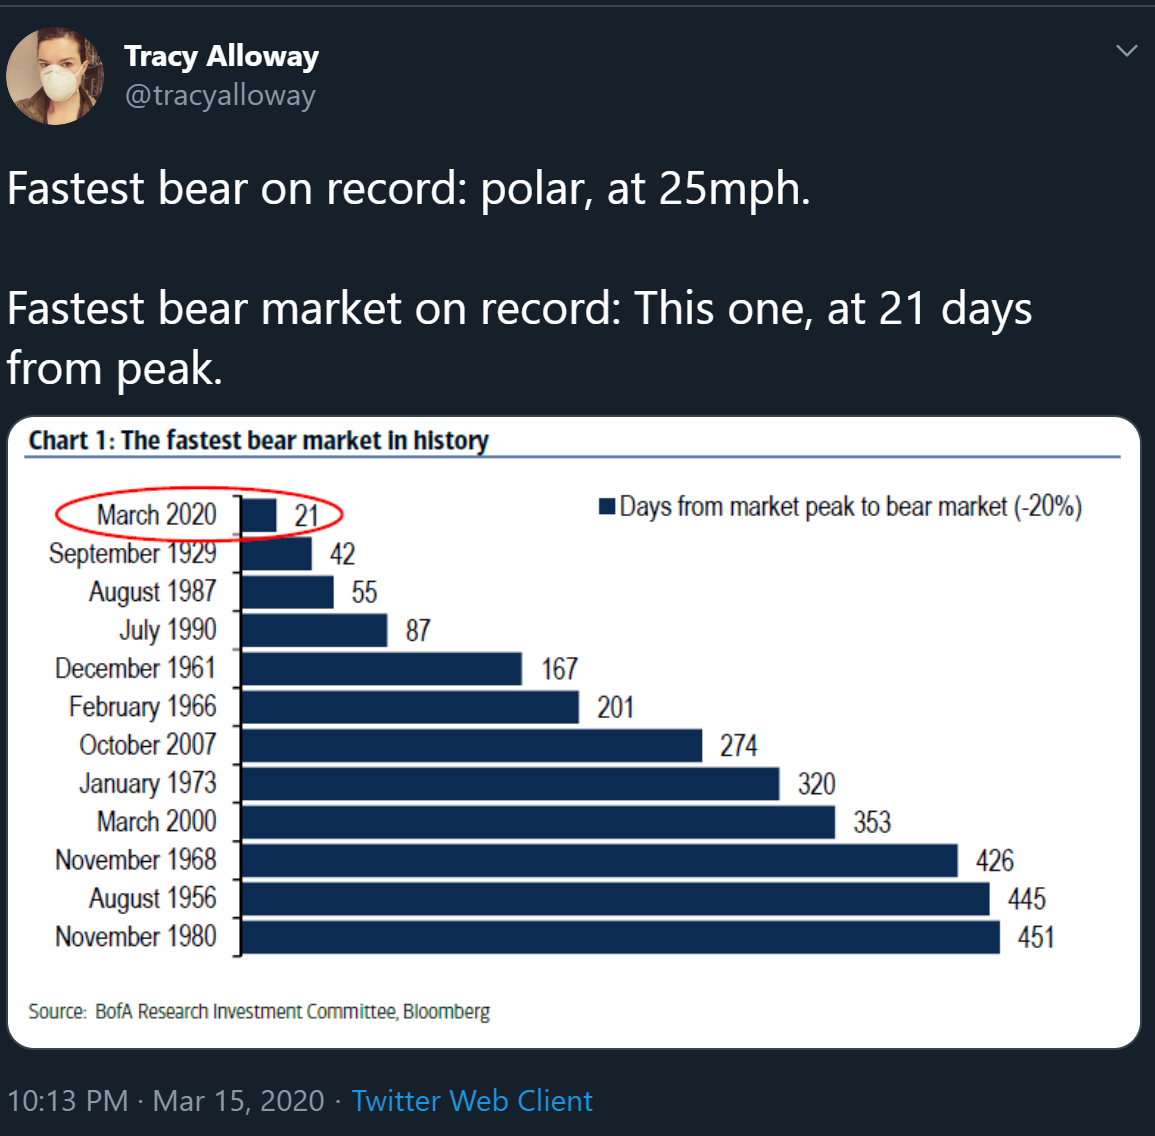
From an economic and investment perspective, saying that the first quarter (particularly March), was without precedent is an understatement. Investors experienced the fastest bear market (from Peak to -20%) ever recorded in US stocks.
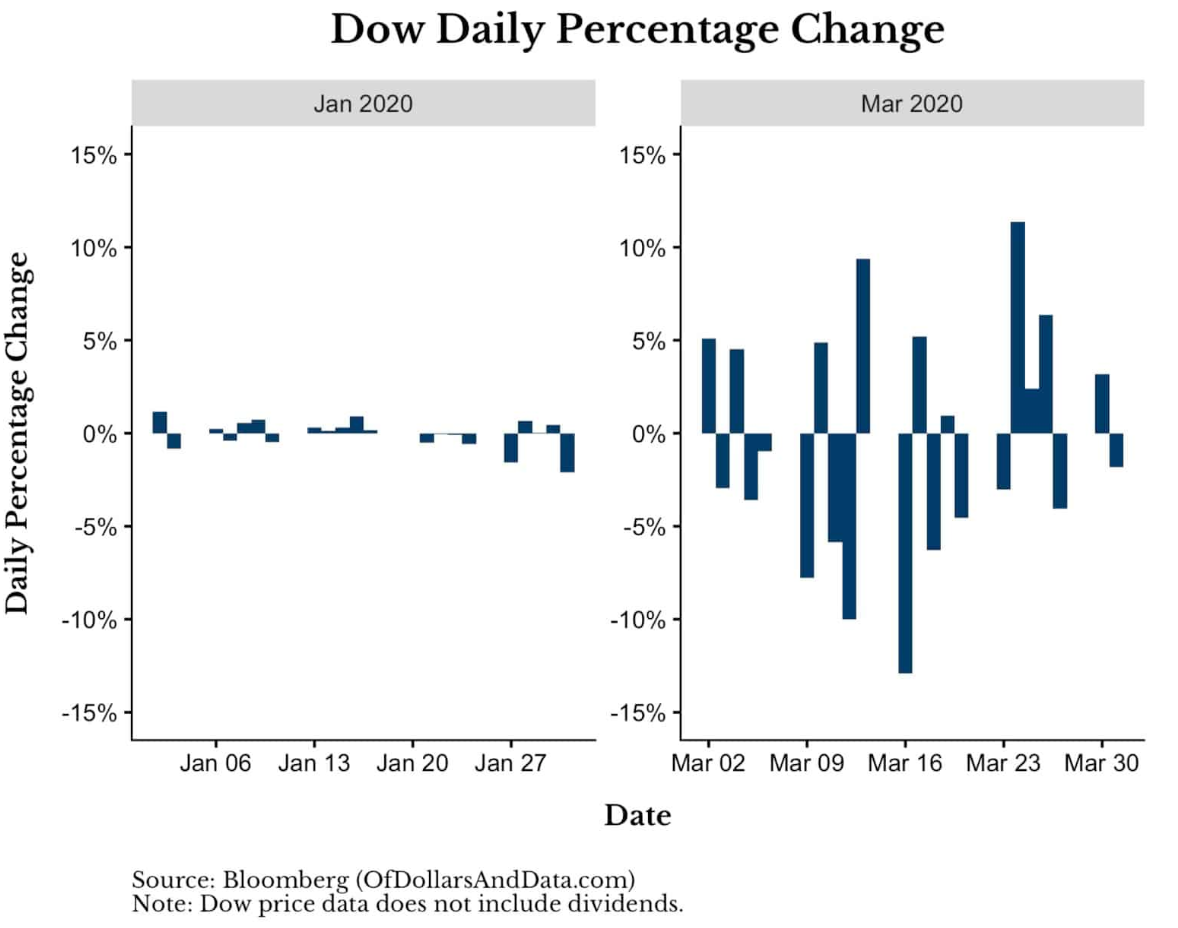
But it wasn’t just down days that we experienced; we had plenty of dramatic positive days as well. As Nick Maggiulli points out, the Dow was down -13.7% for the month of March, but it traveled up and down a cumulative 117% to get there! Those 26,897 sum total of Dow Jones up and down points is 30% more “distance” traveled in a single month than at any time in history.

Maggiulli also shows the stark contrast between the relatively calm January (which felt much like what we wrote about in our post “Do I Belong Here – All Time Market Highs and The Good Place” in January) and the extremely volatile March:
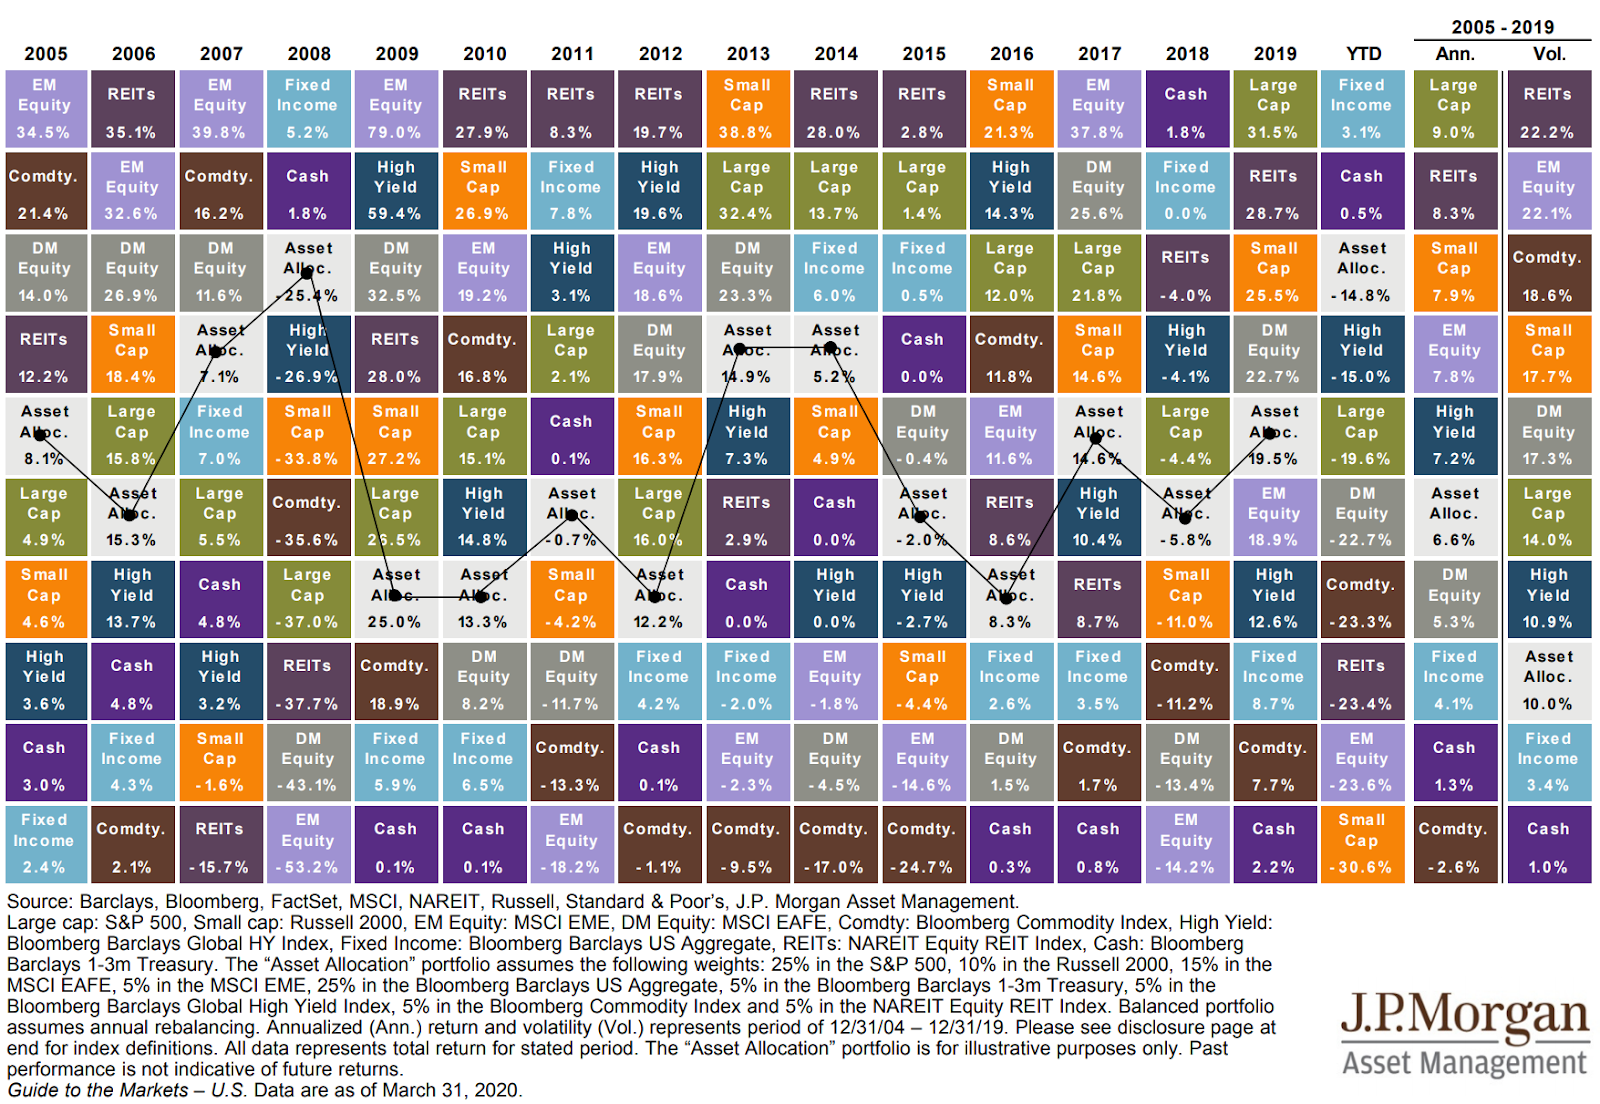
In terms of investment performance, the quarter’s only bright spots were fixed income (more on that below) and cash while risk assets returned -20% to -30% across the board.
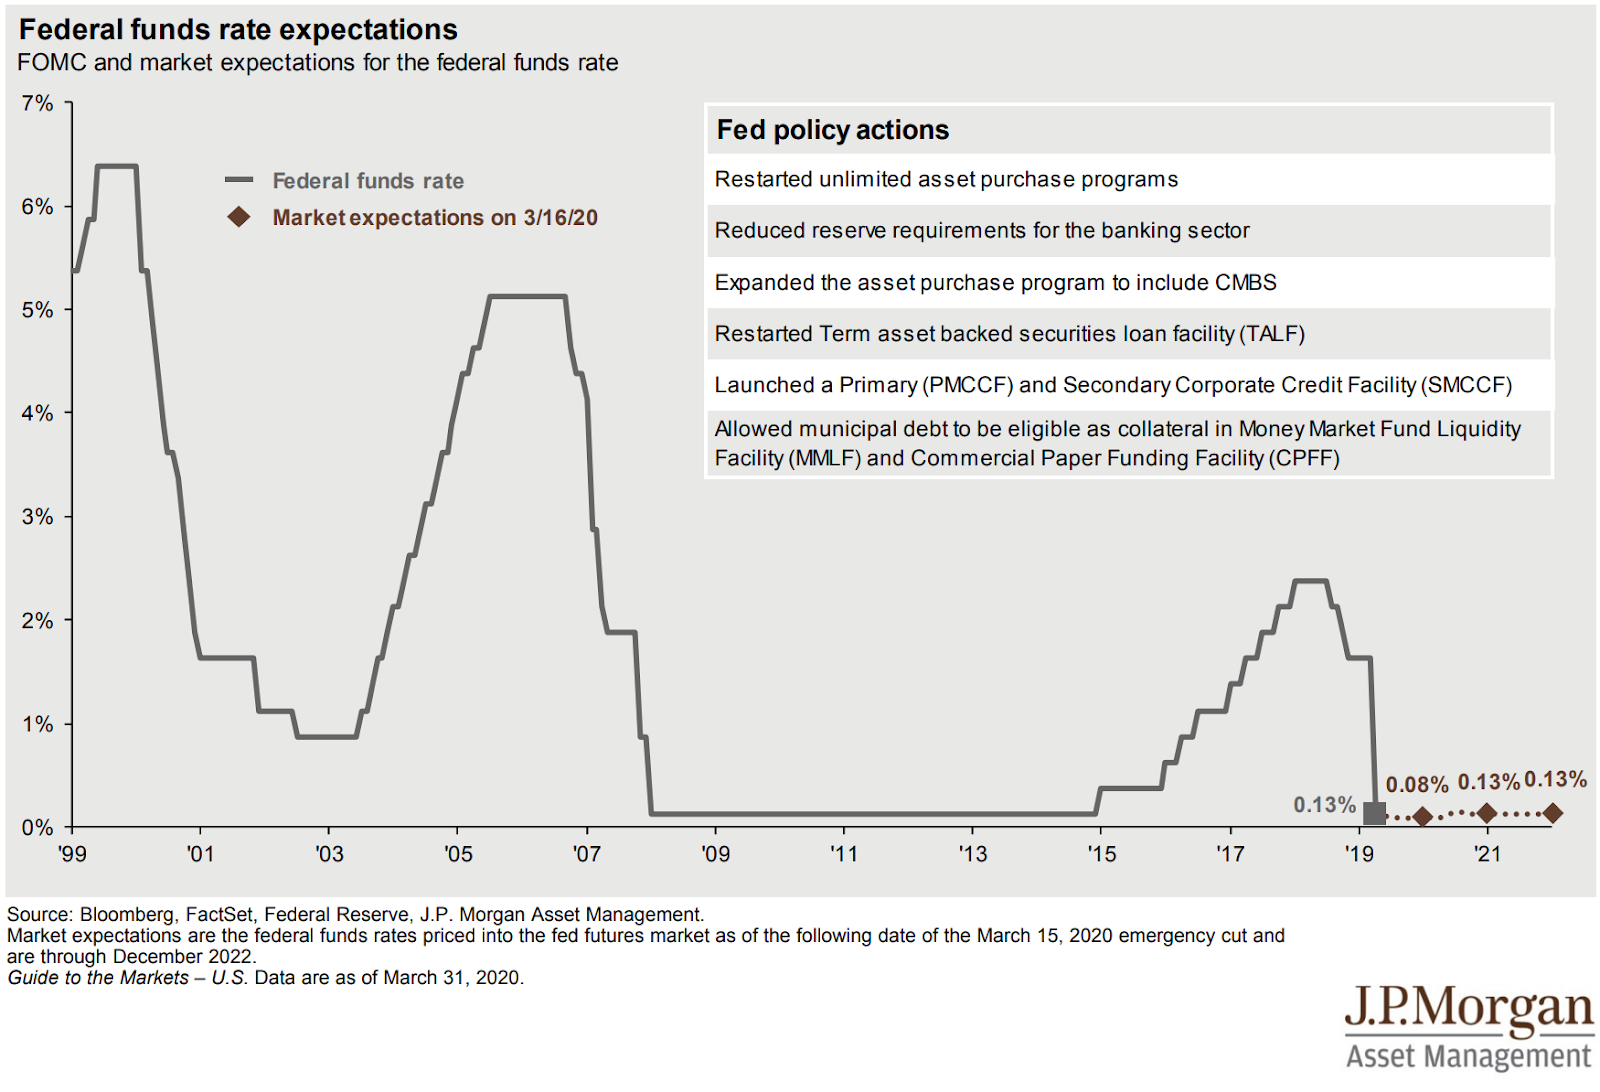
The equity markets get most of the attention on the news, but we’ve had just as interesting developments (if not more) in the bond world. The Federal Reserve cut rates by 0.50% on March 3 and then another 1.00% on March 15. The Fed took additional measures to inject stimulus into the markets by restarting and broadening its asset purchase program.
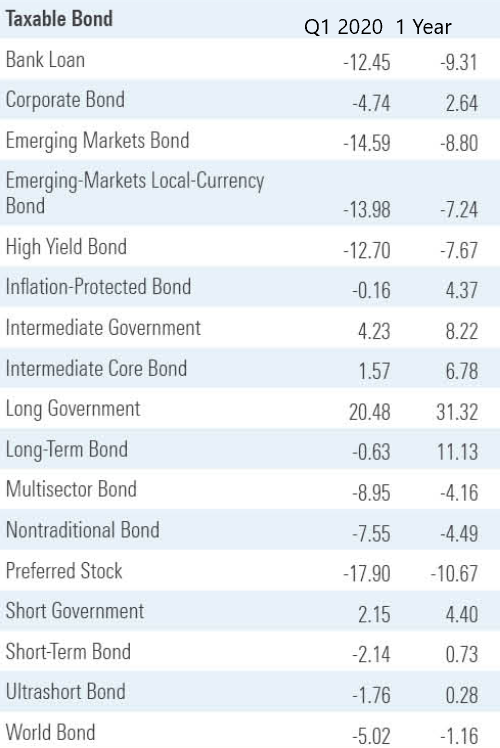
(Source: Morningstar Research)
These unexpected rate cuts caused long-term (interest rate sensitive) government bond prices to jump. However, the bulk of the bond market categories (corporates, municipals, asset-backed, foreign, etc.) suffered or barely held their ground (see chart above) as investors flocked to what they felt was the safest asset: cash.
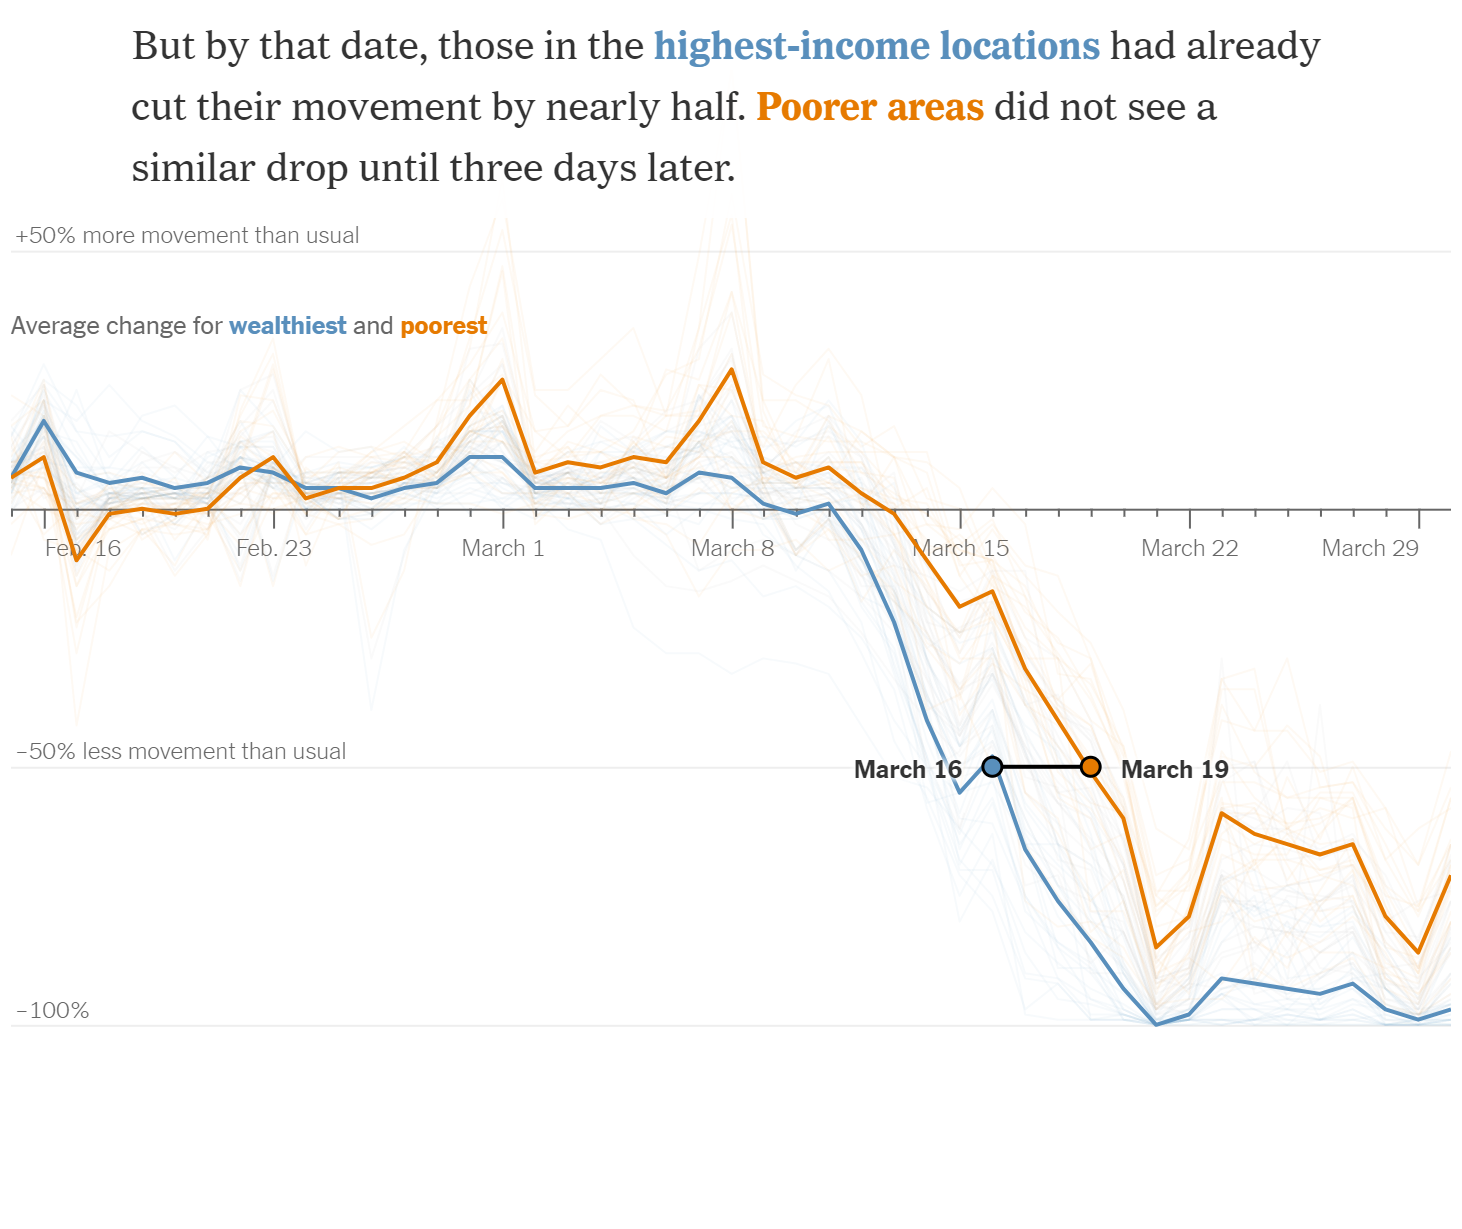
In another fascinating display of data, Nick Maggiulli shows the Flight to Safety he’s observed in AAII’s long-running (33 years!) Asset Allocation Survey. The AAII data shows the 2nd fastest flight to cash since the start of the survey. And an overall stock allocation that has fallen to just 55% of the average portfolio. Maggiulli goes the extra step to show the other times (in green) when, like today, the average investor held such a small percentage of stocks.
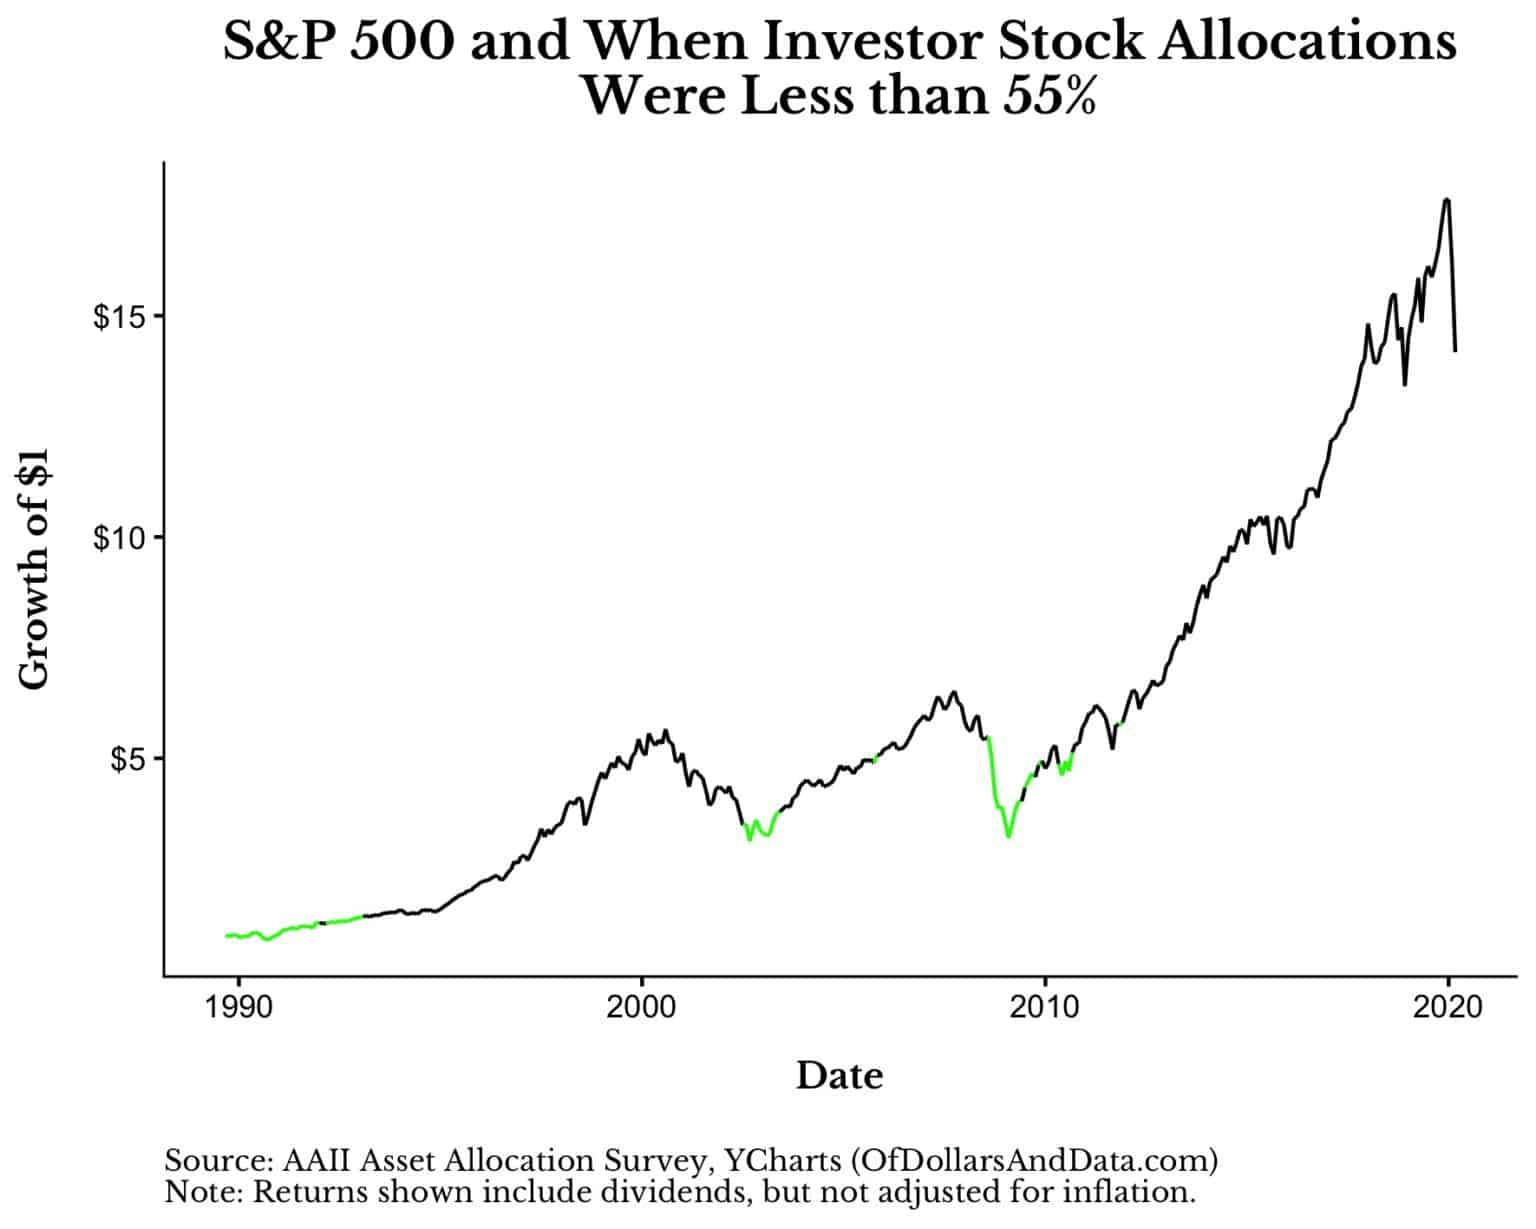
The whole post is worth reading (here), but I think of particular note is the chart above and, in particular, the period above in 2009 a few months before the bottom of the market. One could say that those investors who cut their stock allocation got out at just the right time – before the bottom completely fell out. While that would be correct, it would also only be part of the story. Because not only did those investors have to get out at the right time, but they also had to wait it out and make another decision to get back in. Sounds easy on paper, but it is hard (and rarely worth it) in real life.
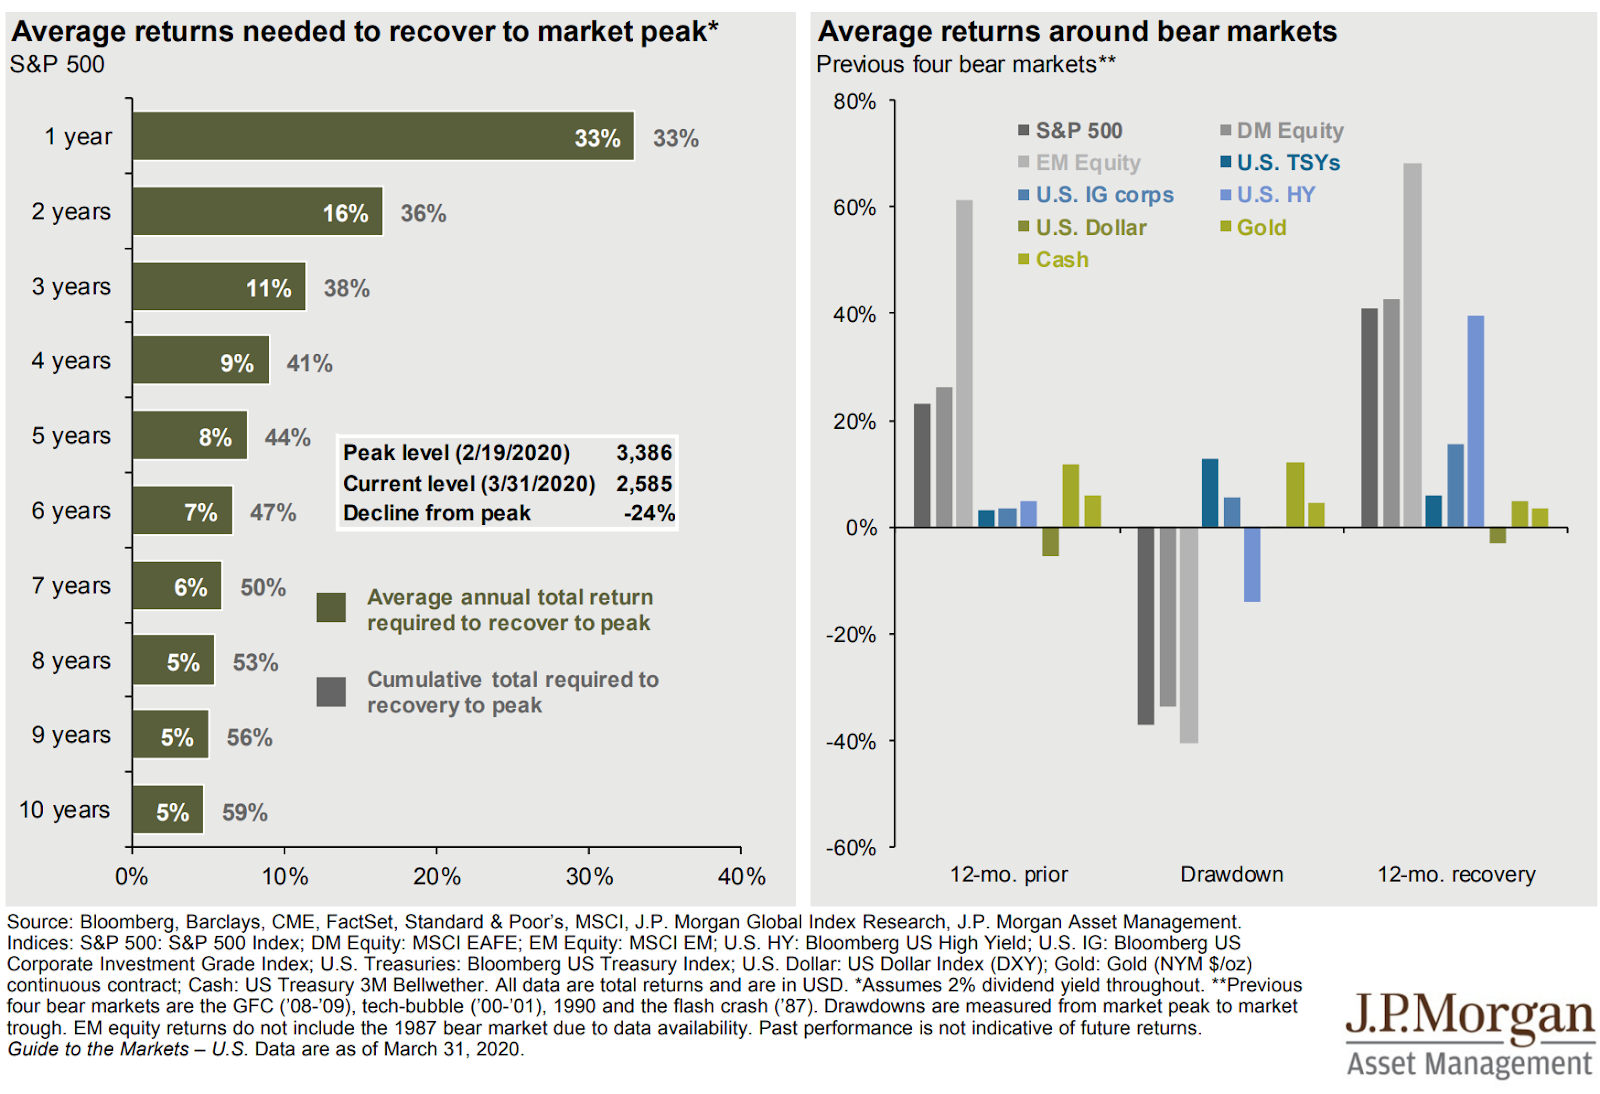
We don’t know what the chart above will look like from here; no one does. But we do know that more often than not, extreme selling is often preceded and followed by better than average returns. As the chart on the right below details, over the last 4 bear markets reaching back to 1987, investors who find themselves in a bear market are often rewarded for their patience. We don’t know when we’ll make it back to market highs again, but the simple math (below left) shows some decent average returns pave the way there no matter the timeline.
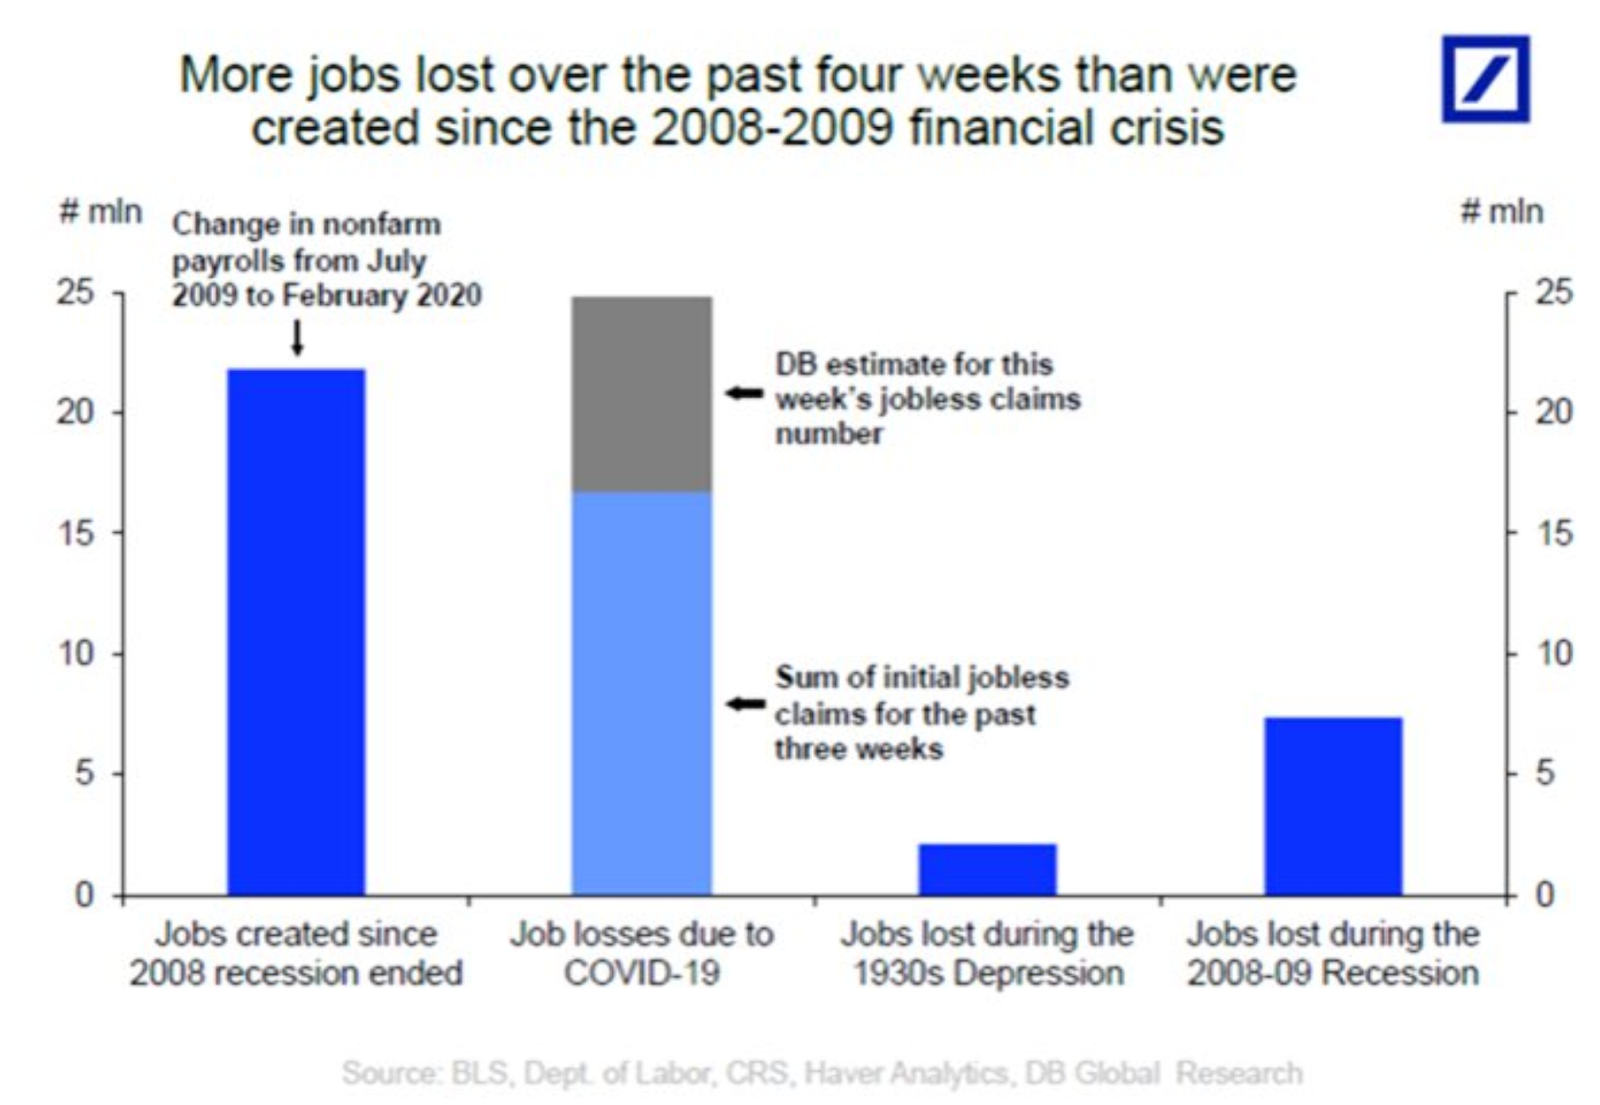
The impact on the US and Global economy will be unpredictable but likely significant. Today, the US likely hit approximately 20% unemployment (in other words, we’ve “given back” all of the jobs that were gained during the post-2009 economic expansion.) Some could say that those are just temporary layoffs that will bounce back – and I’m sure that is true for some portion. But there is plenty that isn’t yet captured in the 20% figure. Because today is also the day that the Paycheck Protection Program ran out of its $350 billion allotment. I imagine there were a number of small businesses that kept employees on the payroll for the last three weeks because of their banker’s assurance that they would be approved, only to find out that they weren’t.
Many of these “lost” jobs are only temporary because they are a direct result of government incentivizing businesses and individuals to flatten the curve (via boosted Unemployment Benefits, forgivable SBA loans to cover payroll, etc.) We will return to normal one day. However, I’m certain there will be plenty of jobs that will be permanently eliminated – and we don’t yet know where that number will land. Of particular concern is the type of worker that will be impacted by both the coronavirus and the economic shutdown. It seems those already living closer to the financial margins will be the ones most directly hit.
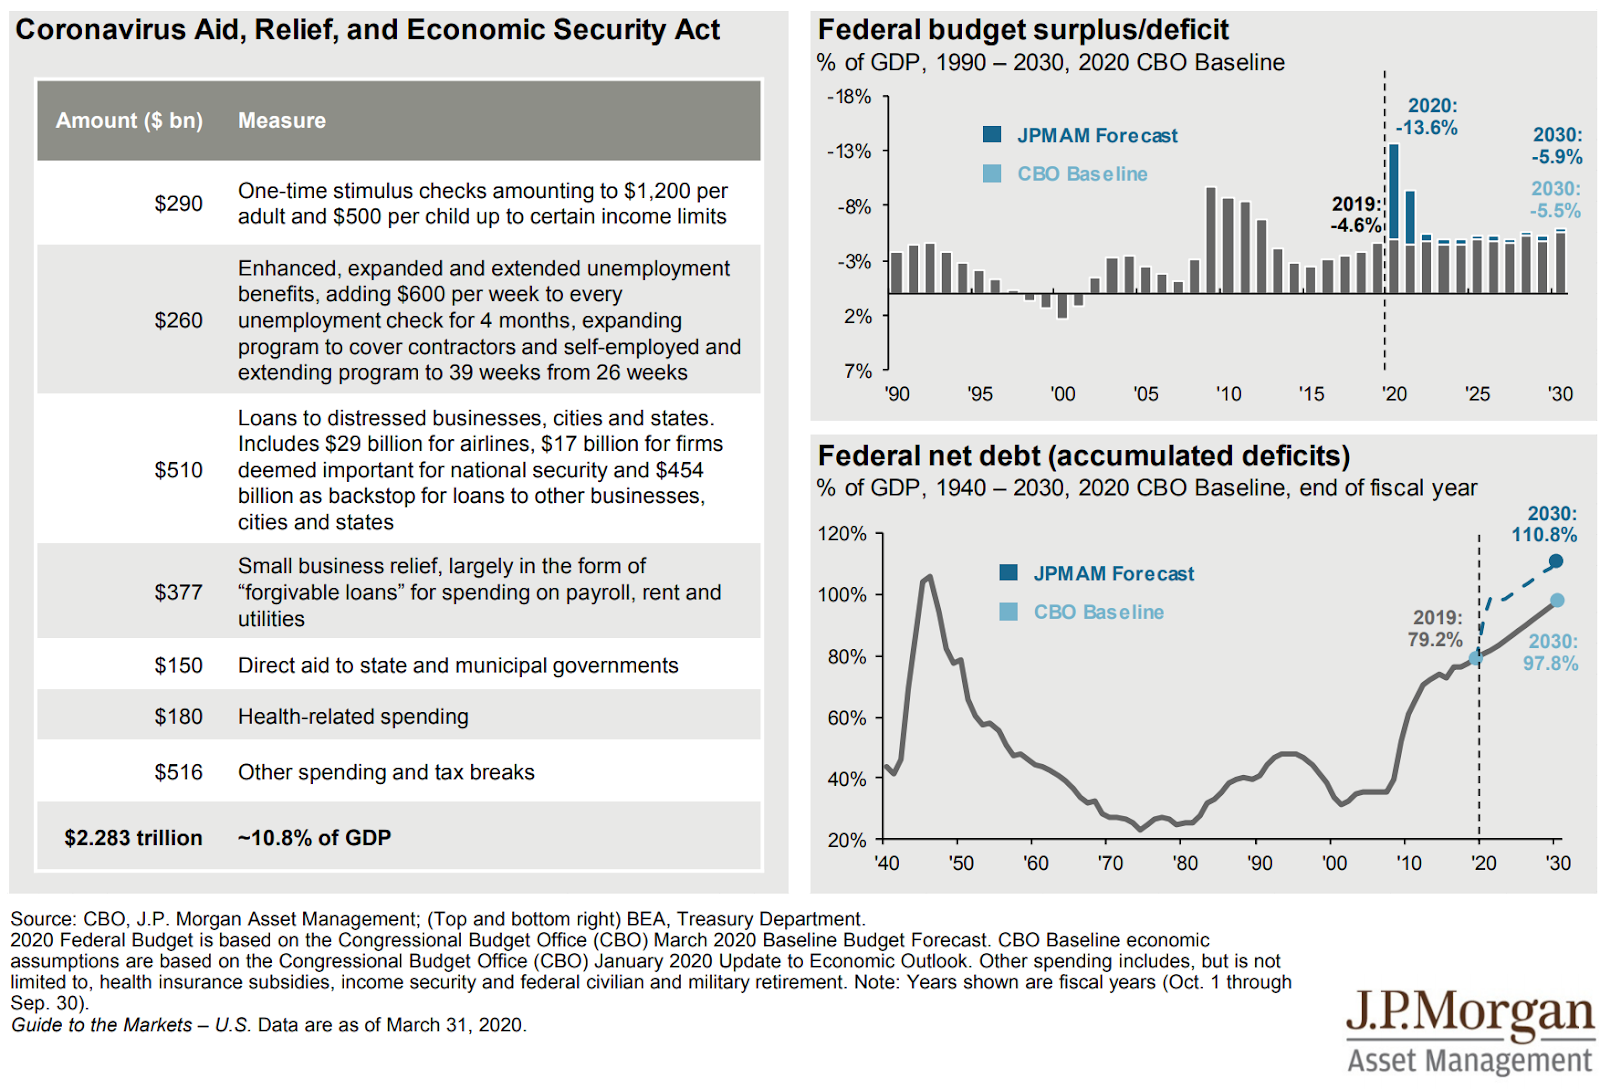
Finally, we need to be aware and plan for the financial implications of shutting down the economy and the government’s (and ultimately the taxpayers’) role in paying for that. The chart below details the initial measures of the stimulus. It is hard to imagine a future without increased inflation and higher taxes.
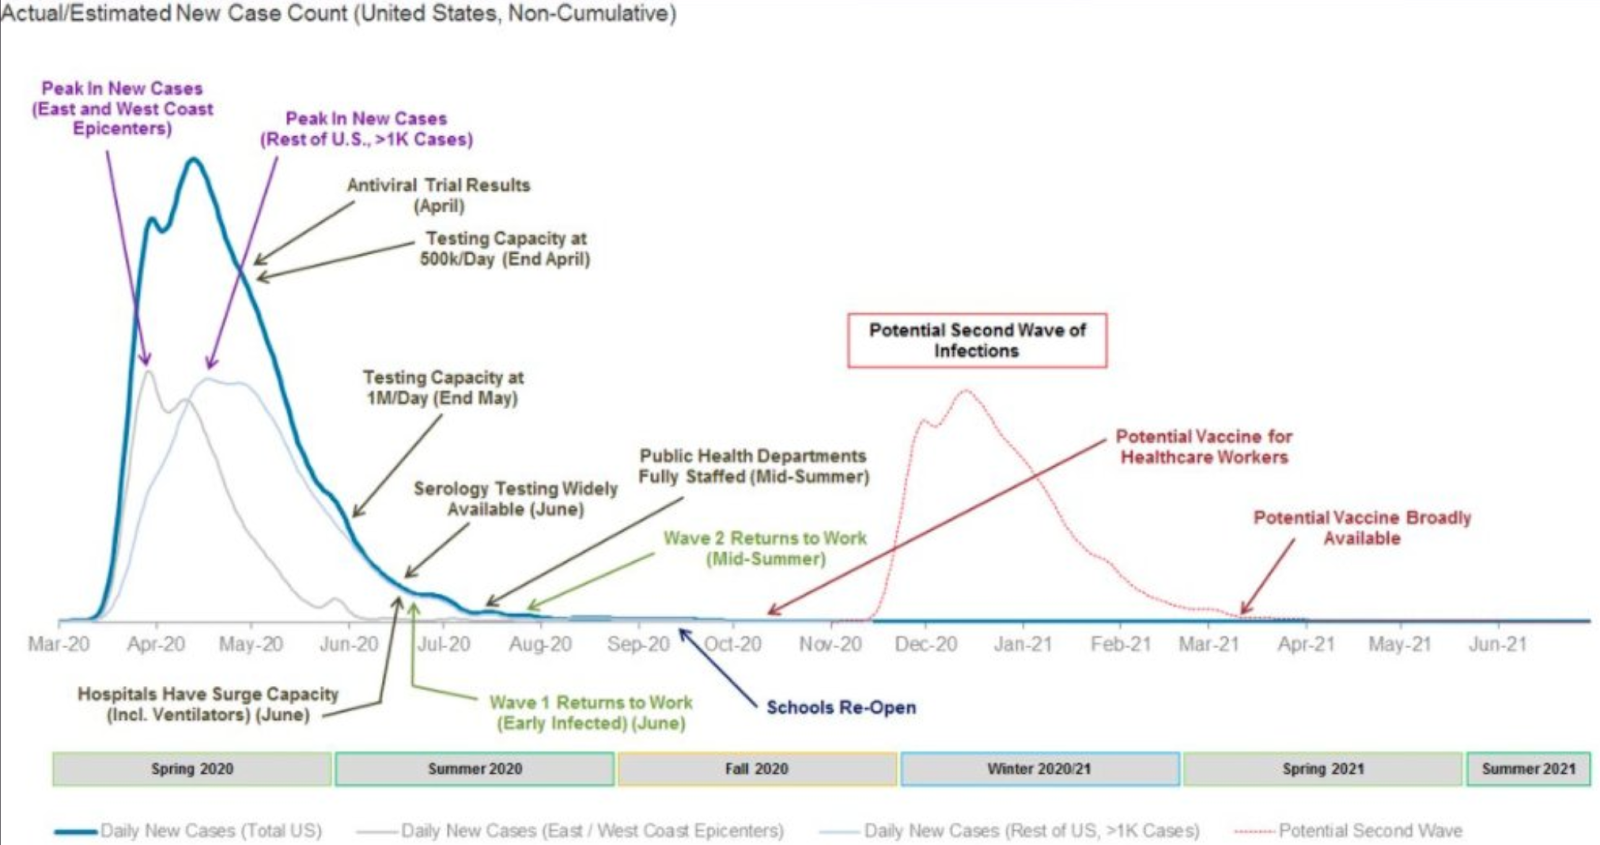
We’ve been asked a lot lately about what we see in our crystal ball. We always say “we don’t have one and don’t believe anyone who says they do.” We don’t know what the infection curve(s) will look like. Or how that will impact businesses or the markets. We don’t know what new policies the Fed or Congress or the President will come up with. We don’t know if or when we’ll have a cure or vaccine (below).
At a time when everyone is an epidemiologist or an economist, we’re going to stick to being asset allocators and financial planners and guides. And we’re going to guide by using normal distributions, rational expectations, and known inputs as our waypoints.


Justin Smith
Latest posts by Justin Smith (see all)
- Quarter in Charts – Q1 2024 - April 19, 2024
- Quarter in Charts – Q4 2023 - January 24, 2024
- Quarter in Charts – Q3 2023 - October 19, 2023