COVID-19 Still Hits Hard
“What a year this week has been.”
That was the response I got from a friend when I asked him how things were going. And it is probably what most of us have felt as we process COVID-19, the economy, elections, and the market on top of managing work, family, school, and staying healthy. In terms of the economy and investment markets, I could also say, “what a year this quarter has been.”
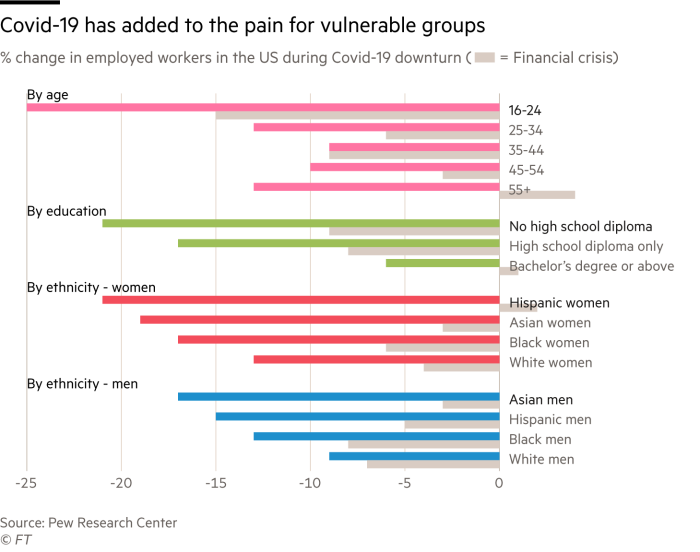
As we can see above, the impact of COVID-19 has spread geographically. But when we dive into who has felt the impact most, we see more clearly who will carry the scars of the virus for longer.
Bloomberg discovered as it looked at “staying at home” numbers, that income and the ability to work from home are directly correlated. And if I had to guess, those ~30% of $200,000 earners who could not telework likely had more protections and less potential infectious contact than the ~88% of workers earning less than $25,000.

The ripple effect goes further from there. As Pew Research and the Financial Times suggest, even though the financial and health impact has been astounding across the board, Asian, Black, and Hispanic Americans have experienced a considerably harder year.
If we look from another angle, we also see the impact of COVID-19 on a different and already burdened section of our population: Women. Anne points out in her blog post that women have experienced job loss at a much higher rate than men. The K shaped recovery (where part of the population recovers and part declines) seems set in motion and hard to stop.
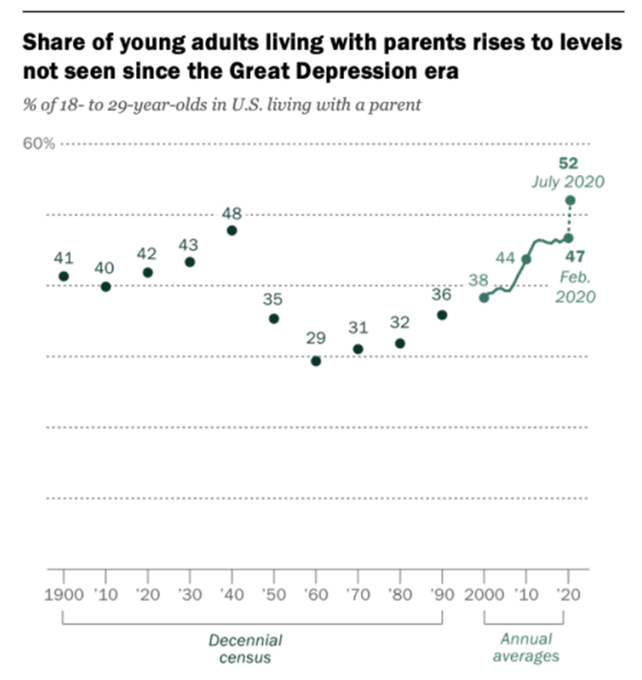
Additionally, we’ve had a handful of clients who, after experiencing an empty nest for only a short period, found themselves packing up a craft or exercise room to make room for their kids again. In fact, we currently have the highest percentage of kids 19-29 living with their parents since…ever. While this may seem inconsequential (and more like the plot of a sitcom) we’ve already seen it impact both parents’ and their children’s financial plans.
COVID-19’s Impact on Foreign, Value vs. Growth, and Individual Stocks
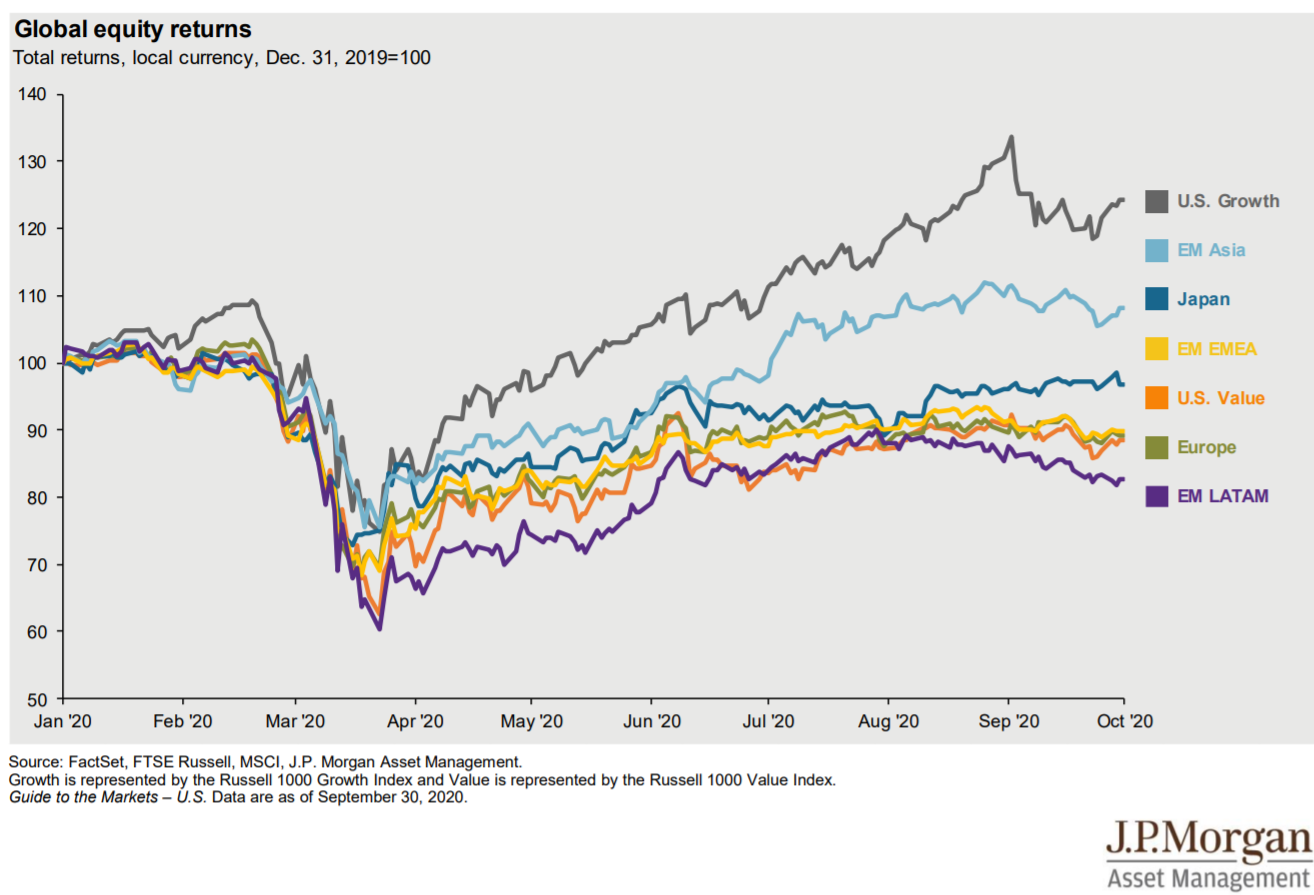
Just as COVID-19 impacts individuals differently, we also see the effects on different countries, sectors, and individual stocks. We can see below that the equity recovery hasn’t been the same across the globe. While US Growth and Emerging Markets in Asia have recovered, all other markets are still 80-90% below their January 1, 2020 levels.
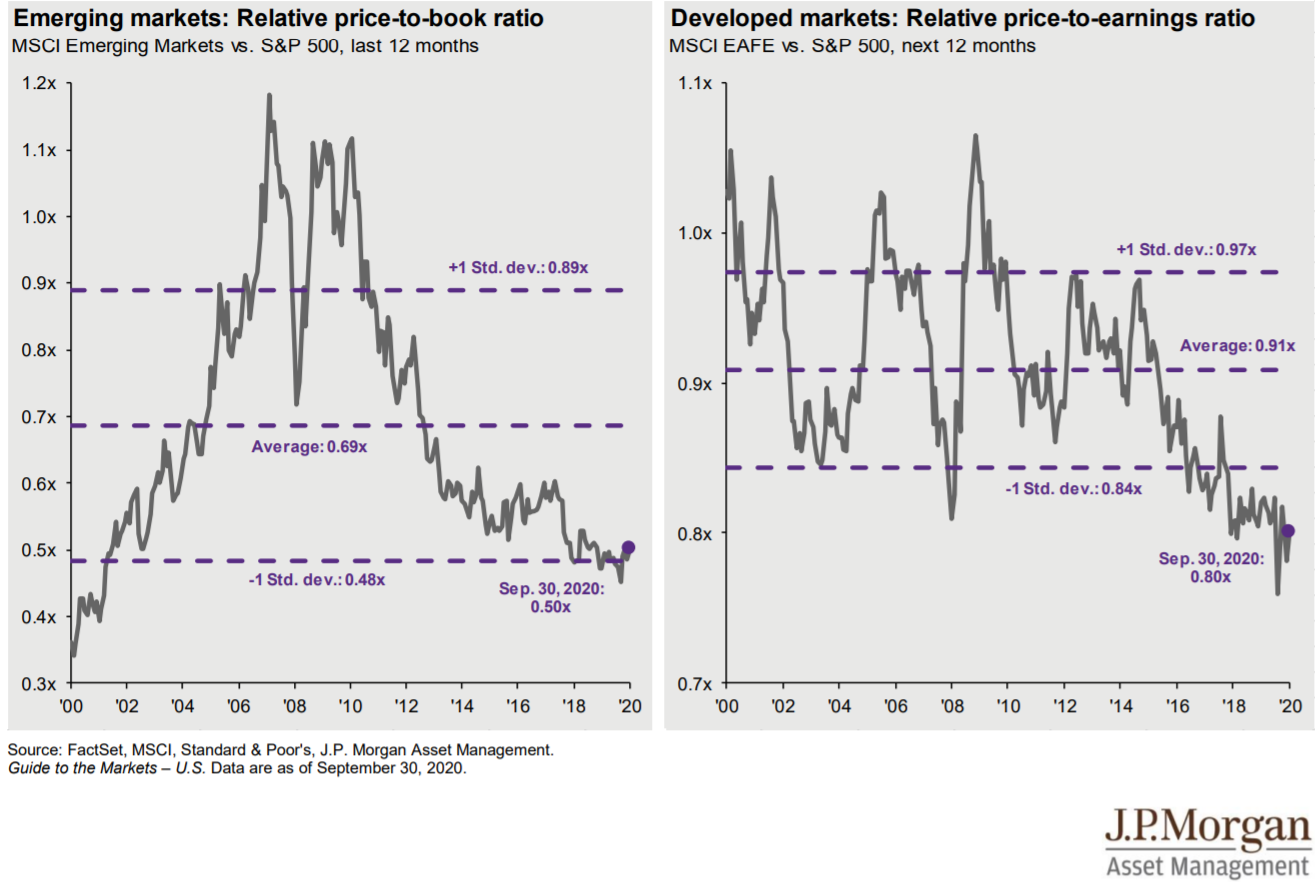
In the charts below, the lag in price recovery puts Emerging and Developed Foreign Markets in extremely rare (-1 Standard Deviation) territory in terms of valuation relative to US Stocks. In other words, compared to US Stocks over the last 20 years, Foreign stocks typically sell for a lower “price per square foot” (usually 30% less for Emerging, 10% less for Developed.) This makes sense due to the US’s status in the world, strong legal system, and high investment adoption. But today, what is typically a 30-10% discount, is now a 50-20% discount. As Morgan Housel points out,
“The hard thing here is reconciling two opposing ideas:
Reversion to the mean is a powerful force and you should expect most things that are disconnected from their long-term averages to find their way back in due time.
Things change, and what used to reliably work in the past often becomes outdated, arbitraged, outlawed, and socially unacceptable.“
Speaking of outsized standard deviation events, what we’ve witnessed in US Growth versus US Value is a divergence of historic proportions. In DFA’s deep dive into the last 90 years of data, they found that the previous three years have been the worst rolling 3-year period to choose value over growth out of the 1,093 available 3-year periods (seen in the second chart below.)


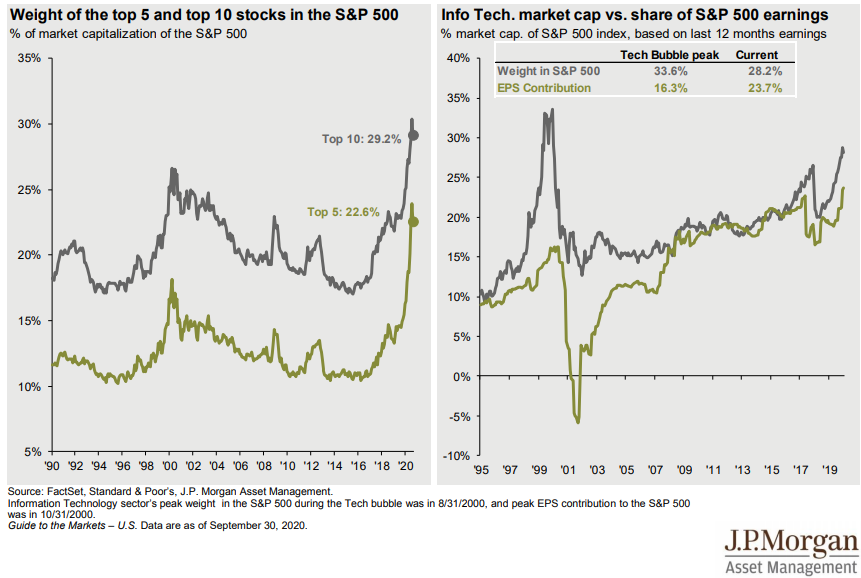
And when we look further into “growth versus value” we end up essentially looking at a handful of stocks versus the rest of the US. Historically, the Top 10 stocks have always made up a large portion of US Investable Assets. We can see below that from 1930 until the 1970s, over 25% of the total value of all US Stocks was made up of the Top 10 stocks.

As of January 2020, we stood at 21%. But in just nine months (!) the Top 10 stocks now take up 29% of the US market and of those, the Top 5 stocks make up 22%.
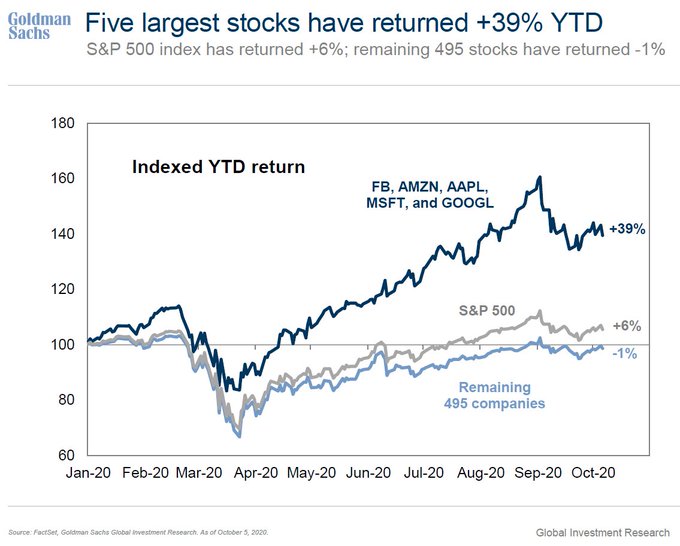
In particular, we can see that since January 1, 2020, the Top 5 stocks in the S&P 500 have returned +39% while the bottom 495% have returned -1%.
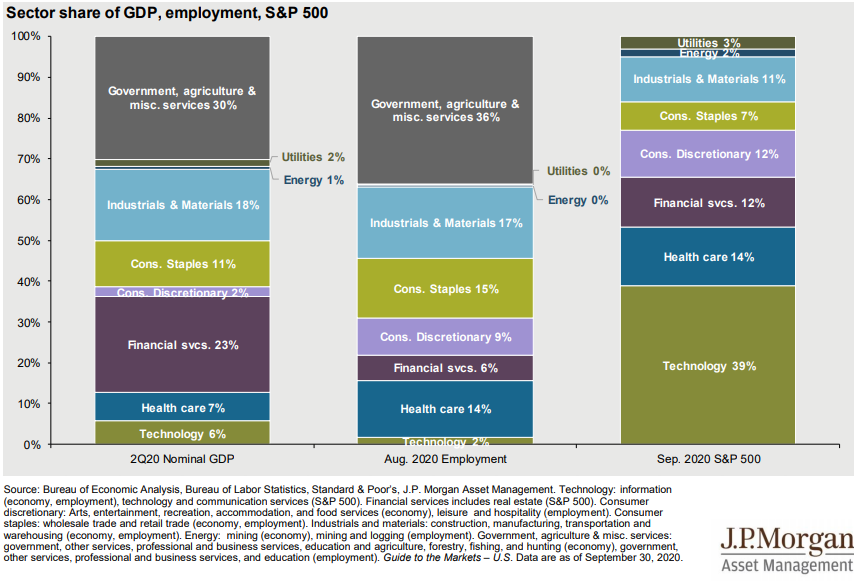
You can probably see the technology theme of those Top 5 stocks. This is precisely what seems to seed the disconnect between the Economy, Employment and the Stock Market. As JP Morgan highlights below, technology makes up 39% of the S&P 500, but only contributes to 6% of GDP and accounts for only 2% of employment.
Election and Tax Plan
As we wrote four years ago, “the direction and magnitude of the ‘Presidential Impact’ (on investments) is far from certain and therefore we think it is fruitless to forecast and irresponsible to plan around.” In Ben Carlson’s blog post about the upcoming election, he delves into the data and comes up with the same conclusion. Ben has some additional questions for investors who plan to sell out of the market based on who wins this election:
If I sell out of the market because of the President, does that mean I have to stay out of the market until a new President takes over?
If I sell out of the market because of the President and the stock market moves higher will I buy back in or continue to sit on the sidelines?
If I sell out of the market because of the President and the stock market crashes will I buy in at lower prices or continue to sit it out based on my political beliefs?
If I sell out of the market because of the President and things don’t turn out as bad as I originally thought, how will I know I was wrong?
So while we’ll continue to monitor and plan for potential tax and business changes that could come with an election, we’re not going to make dramatic investment changes unless we have reason to change a client’s financial plan. In fact, if your particular candidate does not win the upcoming election, our best advice might be to “pretend your candidate won.” We can see below from JP Morgan, that both Republicans and Democrats seem to allow their political party affiliation to impact their view of the economy. As Jonathan always says, “the news is rarely as good or as bad as it seems.” The truth is likely found somewhere in the middle.


Justin Smith
Latest posts by Justin Smith (see all)
- Quarter in Charts – Q1 2024 - April 19, 2024
- Quarter in Charts – Q4 2023 - January 24, 2024
- Quarter in Charts – Q3 2023 - October 19, 2023