Quarter in Charts – Q3 2020
| | | |

Quarter in Charts – Q3 2020

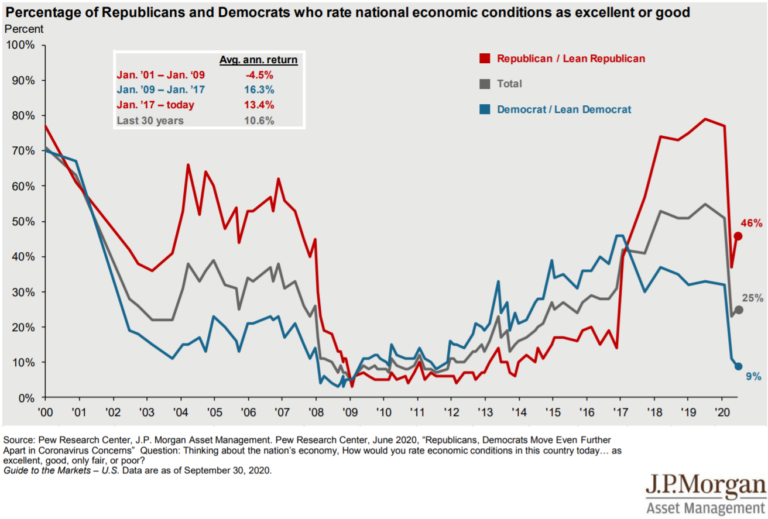
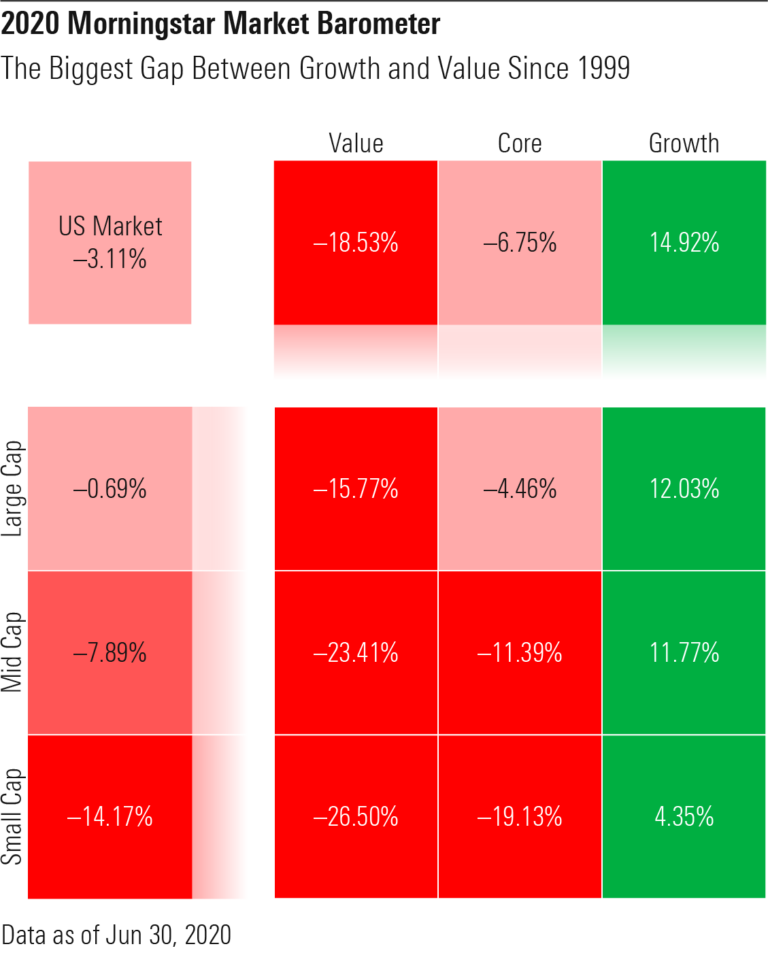
COVID-19 Still Hits Hard “What a year this week has been.”  That was the response I got from a friend when I asked him how things were going. And it is probably what most of us have felt as we process COVID-19, the economy, elections, and the market on top of managing work, family, school,…
Quarter in Charts – Q2 2020
| | | |

Quarter in Charts – Q2 2020

So, How Was Your Day? Your Quarter? Your Year? It’s hard to wrap my mind around the wildly different experiences we’ve all had over the last four months. For every quarantined person who has learned to bake sourdough, many more kids aren’t getting their school lunches. For anyone who has realized they can do their…

Quarter in Charts – Q1 2020
| | | | | |

Quarter in Charts – Q1 2020

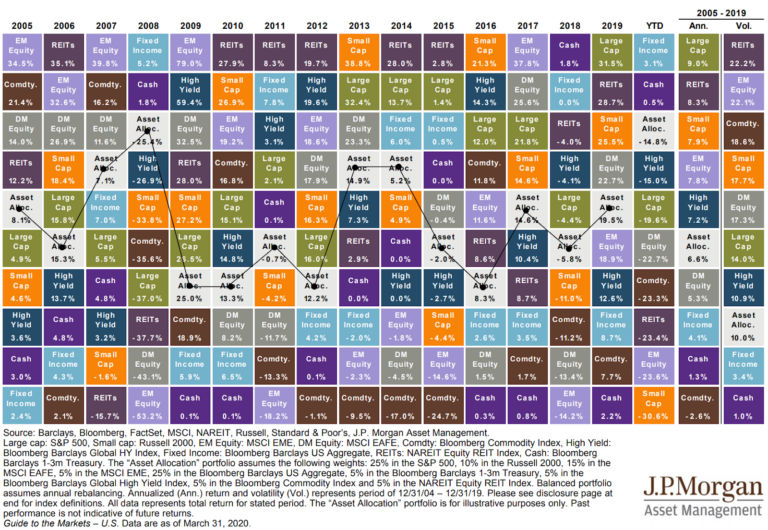
From an economic and investment perspective, saying that the first quarter (particularly March), was without precedent is an understatement. Investors experienced the fastest bear market (from Peak to -20%) ever recorded in US stocks.  But it wasn’t just down days that we experienced; we had plenty of dramatic positive days as well. As Nick Maggiulli…

The Quarter in Charts – Q1 2019
|

The Quarter in Charts – Q1 2019

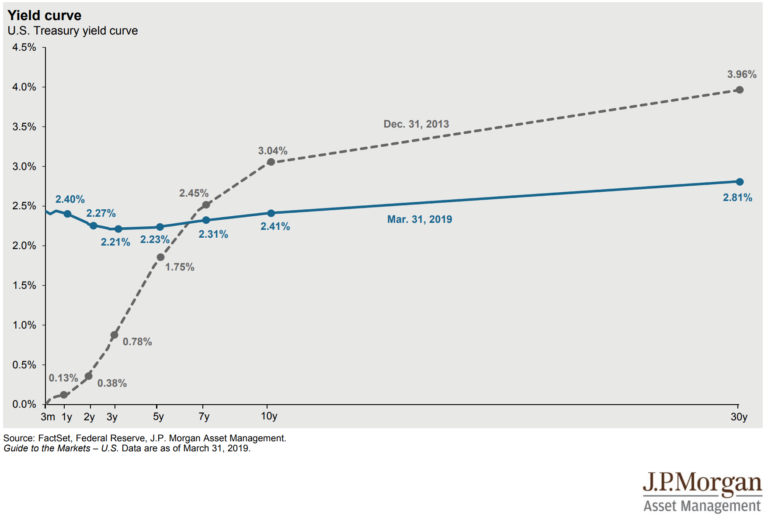
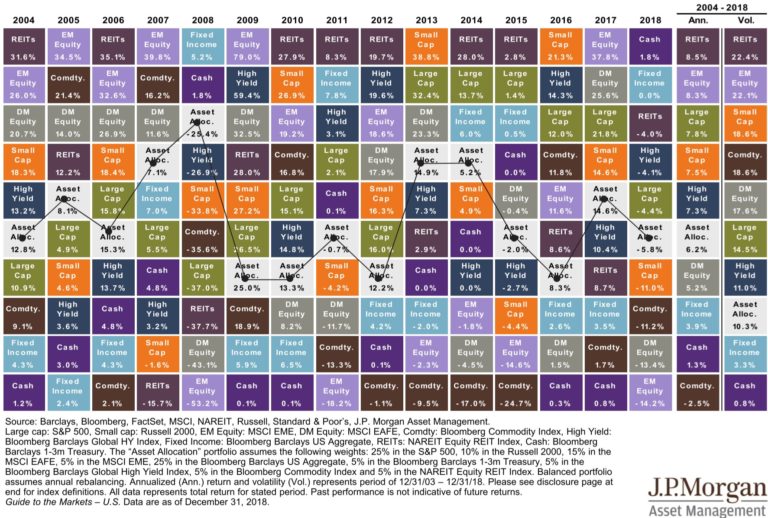
If there was ever a quarter that demonstrated the changing nature of investment markets, it was the first quarter of 2019. Below, we’ll walk through the critical themes of the quarter touching specifically on the yield curve and the possibility of a recession. Asset Class Returns So far in 2019, investors have experienced double-digit returns…