Q1 2018 Market Commentary
The Return of Investor Pain and Volatility
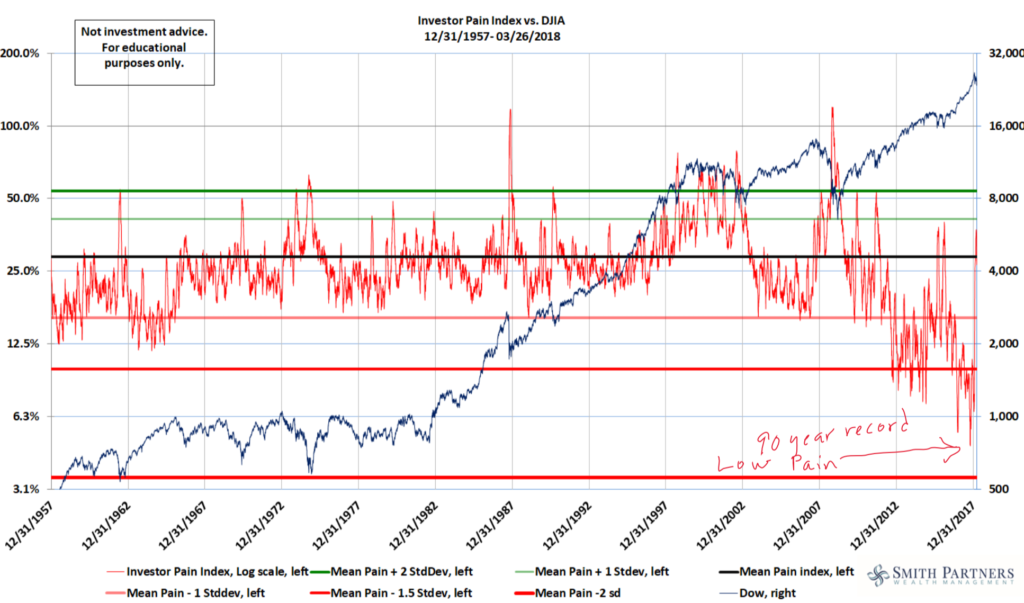
Every few weeks, Jonathan slides a chair up to my desk and pulls out an updated version of a chart, the Investor Pain Index. If you search for it online, you won’t find it. To call it “proprietary” would be accurate but (says Jonathan) far too complementary.
The chart measures investors’ desperation to sell out at prices today, which, at the close, turn out to be lower than yesterday’s low. The Pain Index captures investors’ emotional regret for not getting out at yesterday, a sort of “self-kicking” for selling out today at lower prices than they could have sold for yesterday. We do not base any specific investment decisions off of the Pain Index, but we do pay close attention to the market at the extremes. Just before the recent severe drop in the market, we recorded a 90-year record low for Investor Pain, marked by investor dollars flooding into equities despite the recent record gains and ambivalence to most of the recent drops
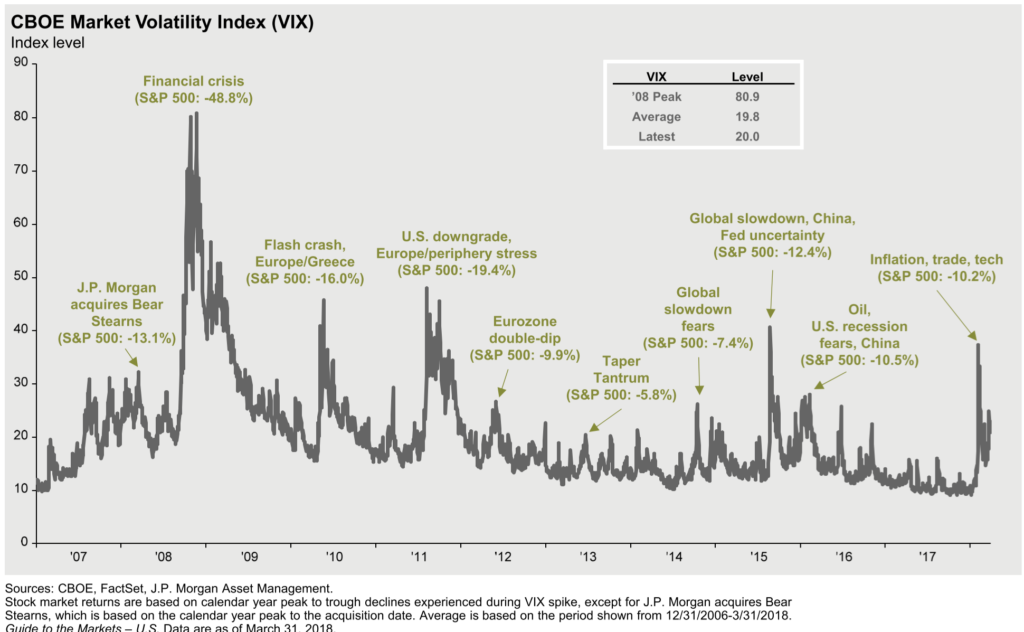
A more familiar (and similar) metric is the CBOE Market Volatility index which also showed a very similar low “fear” just before the recent market dip (and VIX spike). We have been astounded by the quick reversion to “normal” levels of volatility (and increases in the market) after each of the seemingly disastrous events below.
Let Me In!
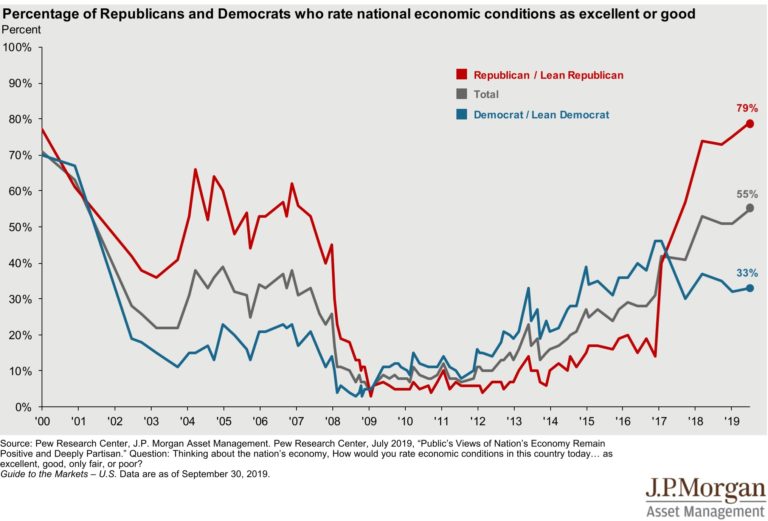
But in the face of harsh headlines, equity investors have continued knocking on the door. We attribute their persistence to a several factors: Strong Earnings Growth, Low Interest Rates, and an Aging Workforce. With these factors in Mr. Market’s favor, it’s no surprise that stock prices have continued moving upward. However, as Research Affiliates points out in a comprehensive article “Why CAPE Naysayers Are Wrong” these data points can show how we got to where we are today, but hardly explain how the market could continue on its upward path.
Earnings Growth
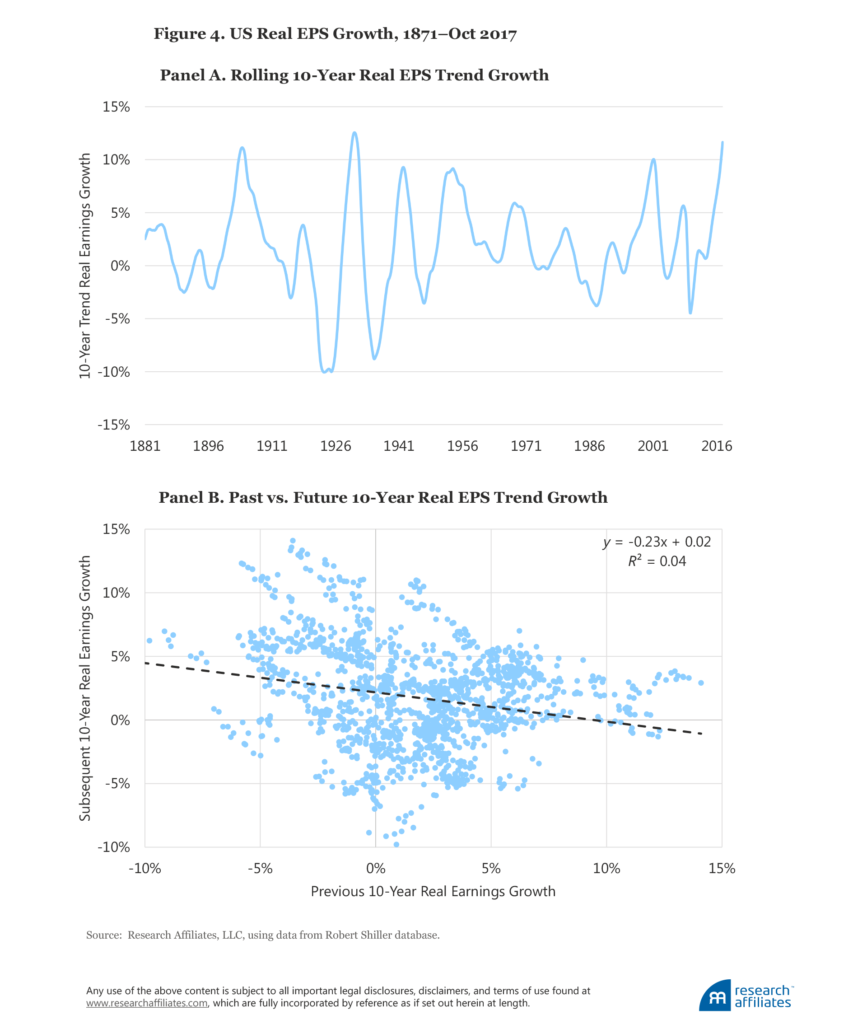
Research Affiliates points out that we have just lived through the second highest 10 year trend for earnings per share growth in the history of the US Markets (see panel A below). While earnings growth contributed heavily to the price appreciation we’ve experienced over the same time, it is no indication that earnings will continue to grow. In fact, panel B shows just the opposite. When investors start out in the “10% to 15% Previous 10 Year” area (the last “column” of panel B) they experience subsequent 10 year earnings growth in the -2% to 4% range. That sort of low earnings growth rate does not justify the high P/E valuations we’ve see today.
 Low Interest Rates
We’ve written before about the impact of interest rates on future stock returns. Similar to the earnings growth story above, low interest rates have done a great deal to explain where we are today. With little incentive to invest in low yielding bonds, investors have tarried in higher risk equities. However, with the Federal Reserve already increasing interest rates (and an expected 2-3 more times this year) the lack of better options begins to sunset.
An Aging Workforce
Finally, an globally aging workforce (chiefly in the US) has several impacts. Primarily, it will impact economic growth. As a workforce ages (the average age goes up because older workers are working longer combined with fewer young people entering the workforce. As Research Affiliates notes:
In 2010, the United States had roughly 4.5 working-age people (ages 20–65) for each person of retirement age. By 2030 this ratio is expected to fall to 2.7.11 Arnott and Chaves (2012) showed that GDP growth is propelled by young adults in their 20s and 30s, and is hurt badly by a population with a disproportionate share of senior citizens. In 1950, the average age of the US population was roughly 30, and one in eight adults was a senior citizen. Today, the average American is 38 years old, 20% of the population are seniors, and both figures are rising quickly. The reduced productivity associated with an aging population, combined with a falling support ratio, should be a powerful force slowing economic growth and associated EPS growth.
Even more interesting, an aging workforce could impact overall investor behavior. As baby boomers age (and see the backside of the real estate and financial crisis) they have been more willing to take on “risk at any cost”. This is partly due to the low interest rates we discussed above, but also due to an increased risk tolerance (“I’m not going to retire for 10 more years and so I can take on more risk”). It’s also a natural response for making up for lost time and money (“I have fewer dollars than I need to retire, so I’ll take on more risk”).
As investors have taken on “risk at any cost”, there is, in our view, a strong possibility that we’ll see the opposite in the future. As interest rate risk and delayed retirements become a reality, we could very well see investors shift out of equities and into bonds, even if the decision is irrational in hopes of finding “safety at any cost”. Anecdotally, we’ve seen both sides of this with our clients; clients wanting to take on more risk than their stomachs can handle, and those wanting to take on less risk than their financial plans can afford.
Knocking on Other Doors
We believe that most prudent and durable investment allocation is one that works in any market environment, regardless of interest rates, stock valuations or market volatility. For an investor to try to correctly time and profit from any of these factors is difficult, if not impossible. Even worse, the process of attempting to time opens the door to more poor choices.
We’ve talked with a few clients in the last year whose story was just this. One in particular was invested so lopsidedly (heavily invested in single stocks that paid a ludicrously high and unsustainable dividend) that they couldn’t stick with it. The problem wasn’t necessarily the returns; they would have been great if they had stuck with it (maybe if they hadn’t opened their statements or watched the news). Rather, the problem was that they were so out of step with the market, that they couldn’t stand to see the market up when their account was down or unchanged.
With that in mind, we also don’t believe an investor’s portfolio should look the exact same regardless of market factors. A “moderate risk” portfolio for a 55 year-old in 2009 should look at least somewhat different than a “moderate risk” portfolio for a 55 year-old today.
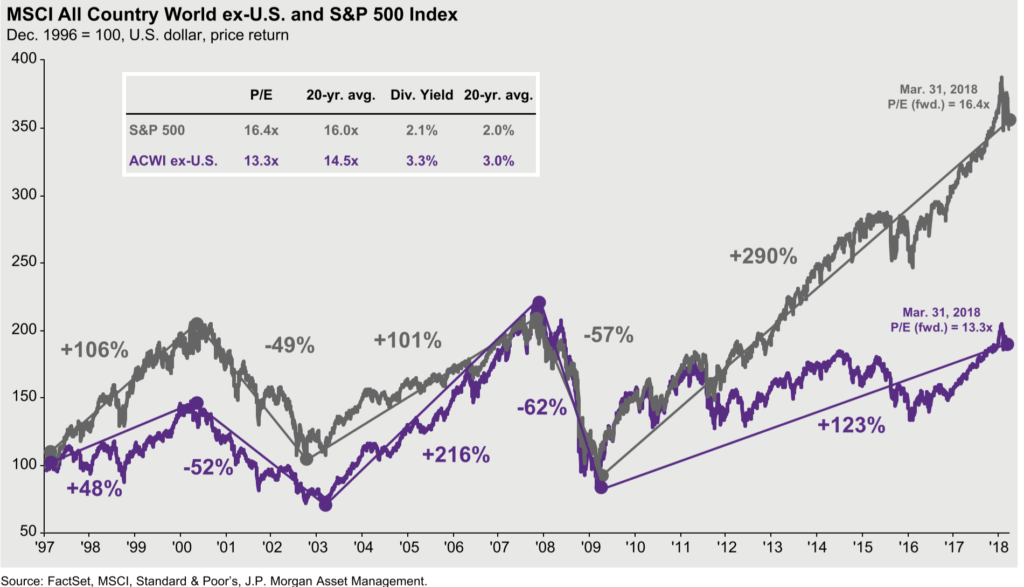
The two charts below highlight what “somewhat different” might look like today. The S&P 500 has been on a tear and is priced higher (in price per dollar of earnings, P/E) than it’s 20 year average. However, a look at the rest of the world (minus the US) shows an index selling 8% below it’s 20 year average P/E with a 50% higher dividend yield.
To put the picture in more detail, the chart below highlights Developed Foreign Markets (EAFE) against Emerging Markets, US Large Cap, and US Small Cap in terms of their Cyclically Adjusted P/E (CAPE). Only the foreign markets (developed and emerging) are selling for below their 10 year average, while US Large and US Small are priced at near all time highs in terms of price per dollar of earnings.
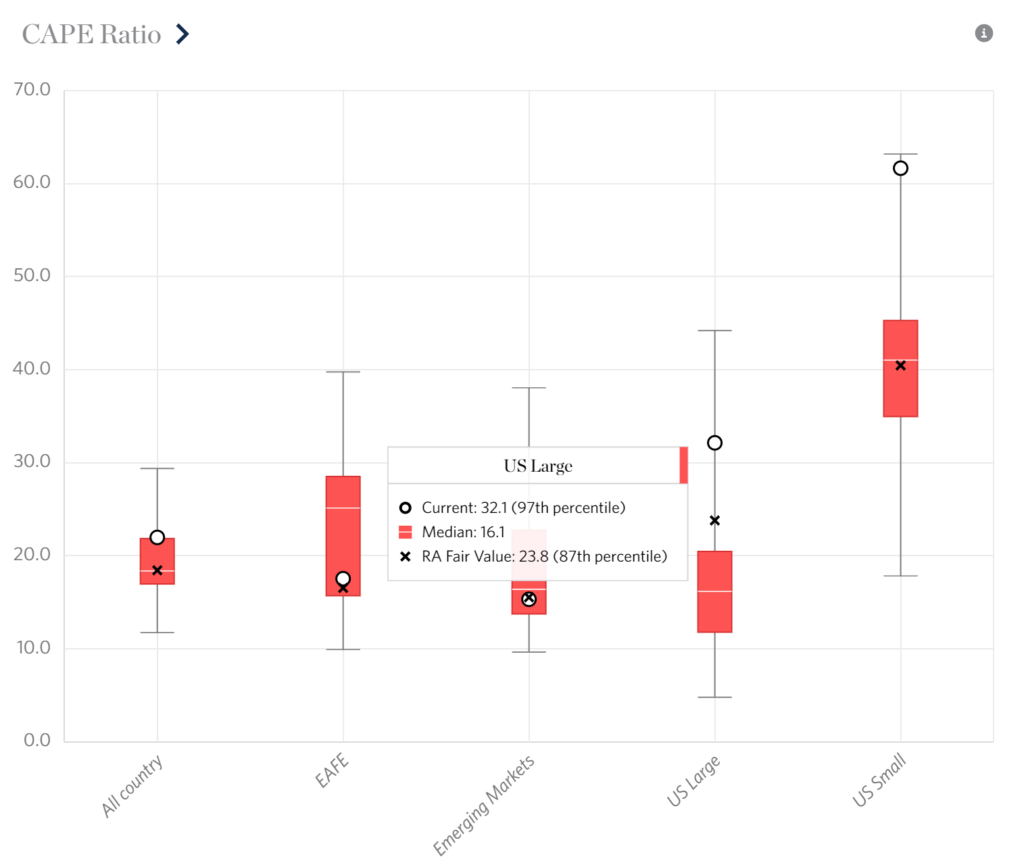
These simply highlight that, in a diversified portfolio, outliers need to be reckoned with, and addressed. Some investors might take on extreme measures to take advantage of these possible “mispricings”. Take US Small Caps as a simple example. If an “moderate risk” 55 year-old investor wanted to own zero US Small Caps, it could make sense: US Small Caps have had a great run and they look overpriced on all accounts. But could that investor stand to be wrong…and for how long…and how would they know to get back in?
Our litmus test for this area (and we apply a similar methodology in all areas of a portfolio): “What’s the right amount of US Small Caps we can own that would protect against investor regret if we’re wrong and protect against an impaired financial plan if we’re right?” That takes work, humility, a knowledge of the financial plan, and communication. It isn’t an easy task, but it is a highly important one.


Justin Smith
Latest posts by Justin Smith (see all)
- Tariffs and a Declaration of Parental Independence - April 11, 2025
- Quarter in Charts – Q1 2025 - April 11, 2025
- Quarter in Charts – Q4 2024 - January 22, 2025