Q2 2017 Market Commentary: It’s a Little Bit of Everything & If God Ran a Hedge Fund
All these psychics and these doctors
They’re all right and they’re all wrong
It’s like trying to make out every word
When they should simply hum alongIt’s not some message written in the dark
Or some truth that no one’s seen
It’s a little bit of everything– Dawes “A Little Bit of Everything”
One of the more frustrating and exhausting aspects of investing is the constant feeling to have to answer the “why” of investment returns. As @YahooFinance Editor Sam Ro pointed out recently, it’s pretty hard:
RBC on stocks and how they go up pic.twitter.com/tKpcDxGuCS
— Sam Ro (@bySamRo) June 26, 2017
“It’s Like Trying to Make Out Every Word…”
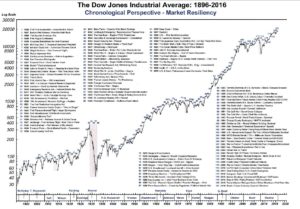
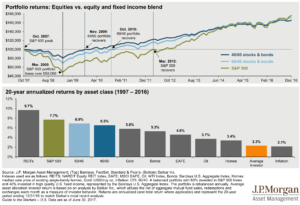
As long-term investors, we will often point to charts that show different world events cast against a background of a rising market, like the one below. But even a chart like this doesn’t show the full story. Every day, there’s a little bit of everything that makes the market move, both up and down. Sadly, it’s also this “little bit of everything” that creates the constant news cycle purporting that everything is important, newsworthy, and actionable.
“…When They Should Simply Hum Along.”
One of my favorite blog posts was recently updated and is worth reading. In “Even God Would Get Fired as an Active Investor”, Wesley Gray, Ph.D. describes his research project in which he analyzes a hypothetical fund manager with 100% foresight. He set up the portfolios to essentially have 5 year lock-up periods, meaning that while he is God, he can still only buy and sell once every 5 years. His summary:
Question: If God is omnipotent, could He create a long-term active investment strategy fund that was so good that He could never get fired?
The answer is striking: God would get fired.
“God’s” investment results would be amazing. His ability to compound assets at 29% annual clip are unbelievable…well really they are actually quite believable…because in this hypothetical scenario He is all-knowing. Of course on the way to these great returns is a standard deviation (variability of returns) that is higher than the market, but not outrageous.
“Umm, God, We’d Like to Talk About Your Investment Strategy”
But as Gray points out, the most surprising aspect of the “God_Best” Portfolio are the periods of negative returns. Multiple times over God’s tenure, his fund would experience drawdowns of -20%, -30%, -40%, even -75% on its way to being the absolute best possible fund over 5 years.
Taking it a step further, Gray comes up with a Hedge Fund version where He could go long the best stocks (make a profit from the best going up) and short the worst (also make a profit from the worst stocks going down). This “God L/S” (long/short) portfolio obviously has even better returns than the long only “God_Best” portfolio.
“Sure, But You’re Not Even Beating the S&P This Year…”
Overtime, the “God Long/Short” portfolio would compound assets at a 46% clip on an annualized basis and, as Gray points out, would quickly own the whole stock market. But on the way there, the fund (this perfect fund which makes Warren Buffett look like he’s just throwing darts to pick stocks) would experience drawdowns as much as -47%! That would be extremely hard to stomach.
Even worse would be the comparison. Over the tenure of the “God Long/Short” fund, it would underperform the S&P 500 often. And this underperformance versus the S&P wouldn’t just be for a day or two and/or at a couple of percent. At times, it would underperform the S&P 500 for years and could range from 20-50% relative underperformance.
Not only would this all-knowing capital allocator be fired by plenty of clients, but Gray points out He would make the Wall Street Journal and Barron’s covers as they question if He had lost his investing power. The amount of bad press would be of biblical proportions.
“It’s a Little Bit of Everything”
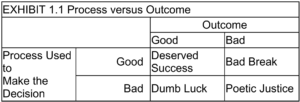
Our takeaway from Gray’s research is two-fold. First, if one’s investing and financial planning process is built on sound principles, then the outcomes will usually take care of themselves. As Michael Mouboussin points out in More Than You Know, it is not enough to only look at Outcome, one must also look at the Process. Here, the process is “complete omnipotence” but the outcome would still oscillate year to year between “Deserved Success” and “Bad Break”.
Secondly, the behavioral component of investing and financial planning is extremely important. As great as these omnipotent returns are, if the investor were not prepared for the drawdowns, they would have never stuck around to experience the returns. This is why it is so integral to line up an investment portfolio with an investor’s “stomach for risk” (the risk the downside they can emotionally handle, even if their financial plan could handle more) and their “wallet for risk” (the amount of risk that makes sense in their financial plan, regardless of their emotions).
Market Recap
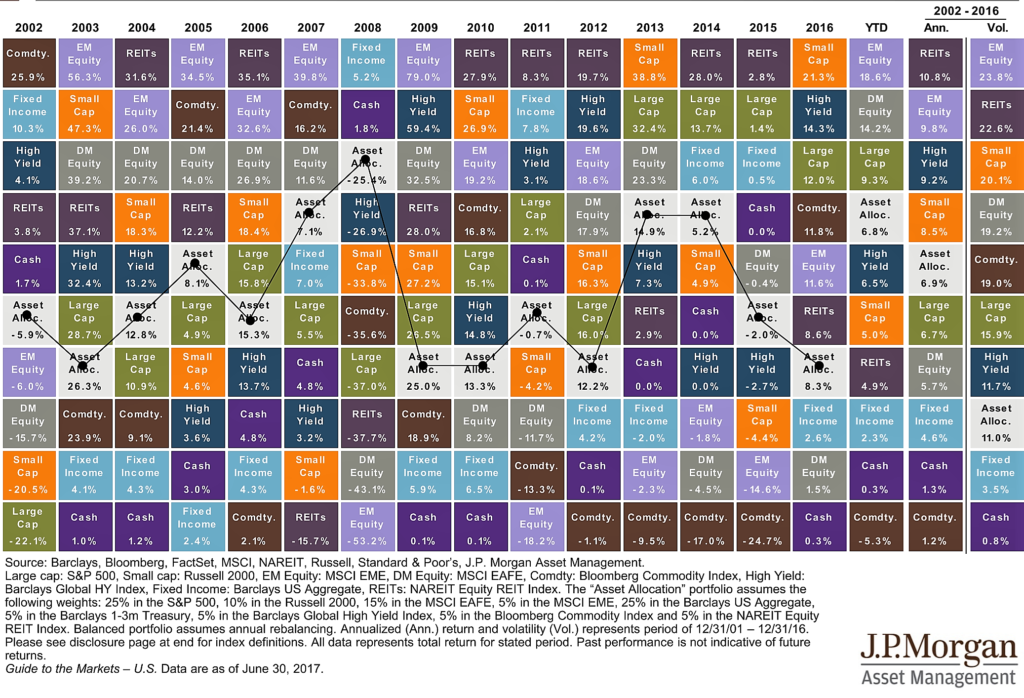
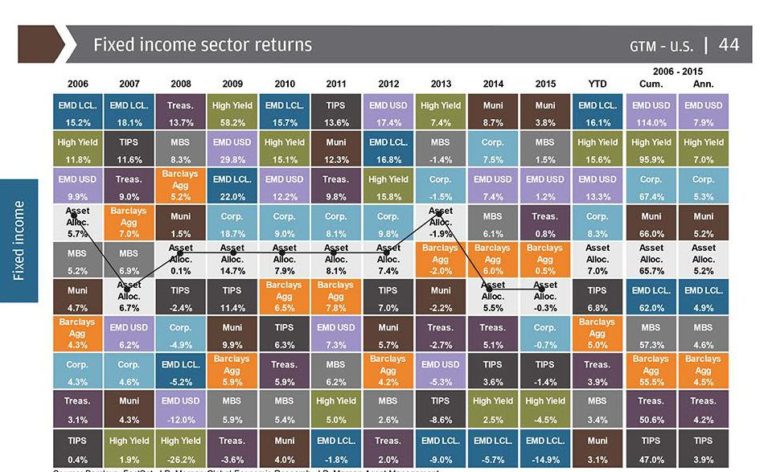
As we can see in the “quilt” chart, Emerging Foreign Markets and Developed Foreign Markets stocks have lead the way so far in 2017 followed by US Large Stocks, US High Yield Debt (Junk Bonds) and Small Cap Stocks and Real Estate Funds. In the face of rate hikes in March and June, Fixed Income has still continued to post moderate gains. For many investors, however, the more important return looks something like the “asset allocation” like. This portfolio captures some of the highs, some of the lows, and earns a good return as long as the investor doesn’t jump ship.
As the verse at the beginning of the commentary suggests, this is the path of not “trying to make out every word” of what the markets will do, but rather earning returns by simply “humming along”. It isn’t a strategy for everyone. As financial planner Michael Kitces half-jokingly points out, “diversification means always having to say you’re sorry” because there will always be an asset class that outperforms the diversified portfolio.
Or Maybe No Apology is Needed?
However, index returns printed in the paper or flashing on the TV are rarely what individual investors have earned. As JP Morgan Asset Management also points out, a Dalbar study shows that the average investor over the last 20 years, only earned an average annual return of 2.3%, just ahead of inflation and just behind Oil and Housing appreciation. This is in stark contrast to the S&P 500, 60% stock/40% bond portfolio (or 40/60 portfolio). Why? Because these represent “humming along” when the average investor (this includes financial advisor driven dollars as well) wants to try to “make out every word” of what will happen in the markets and inevitably falls flat.
