Quarter in Charts – Q2 2024
A Quarter on Repeat
Our family has a handful of stories we tell on repeat. There is the one about my driver’s ed instructor who made me go through the Burger King drive-thru to pick up her lunch (a “Whopper with no mayonnaise this time!” emphasis hers.) After discovering mayonnaise on her Whopper, she made me drive back through and hurled the burger into the cashier’s window, narrowly missing my face. There is also the more recent story about how, for a year, I accidentally called my new barber “Merrl” (with an “L”) rather than her actual name, which is “Merri” because the dotted “i” was hard to see when I booked the first appointment on my phone.
This quarter feels like a story repeated, though less entertaining than my embarrassing tales. After a shaky start, US stocks have climbed to new heights, while bonds and foreign stocks have trailed.
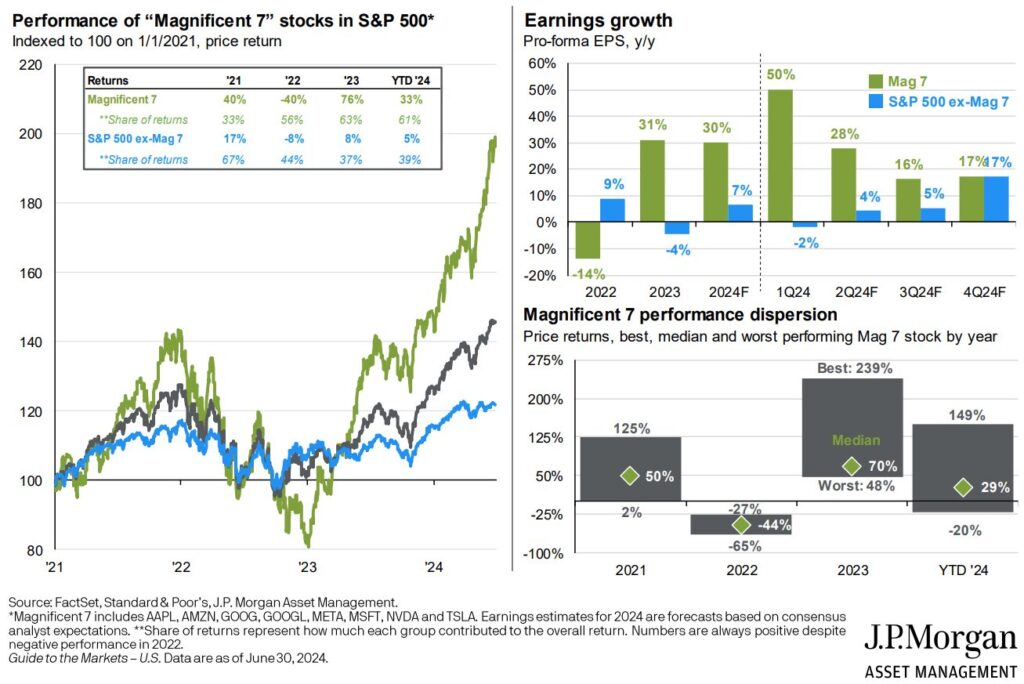
Once again, the US stock stampede has been led by the “Magnificent Seven” large-cap tech stocks. These seven stocks account for 61% of the S&P 500’s return year to date. Without them, the S&P 500 would only be up +5% this year (see chart below left).
Since all seven of these stocks are considered US stocks, it shouldn’t be surprising that US stock index returns have continued to lag foreign markets. Except for the 2021-22 downturn, foreign stocks have experienced their most extended period of underperformance in recorded history.
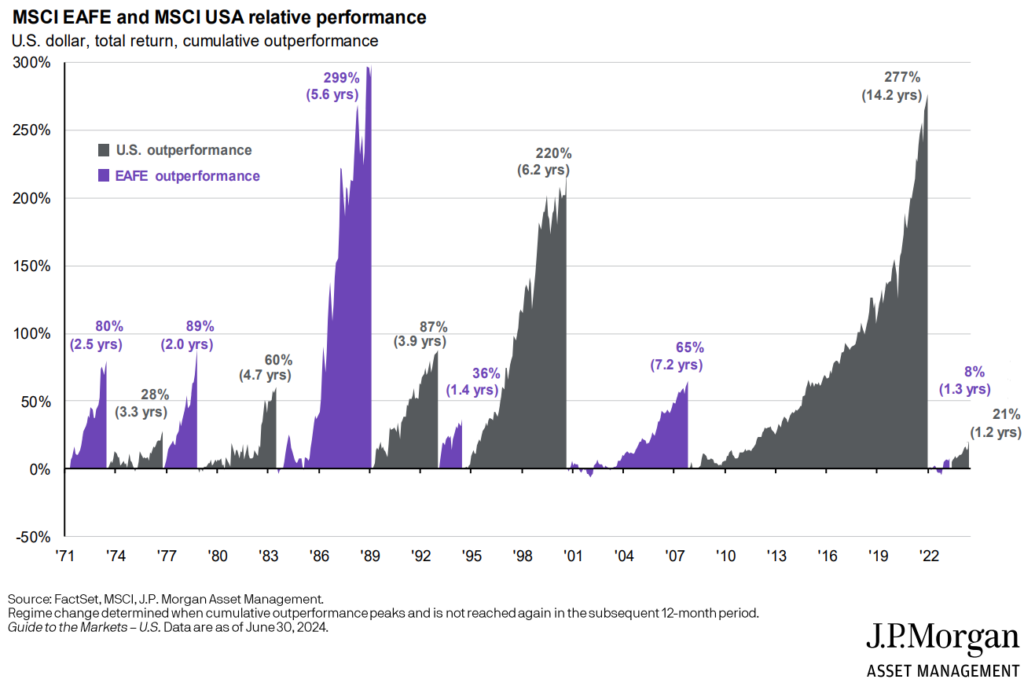
It is easy to see the cyclical relationship between foreign and domestic stock returns. But have we entered a new normal or US dominance? Or could foreign stocks still serve a useful purpose in a diversified portfolio?
It might be helpful to make comparisons to the newest entrepreneurial experiment in my household: The Trash Pandas. My eleven-year-old, Everett, started a new business this week. For $1/week, he is taking out our neighbors’ trash, recycling, and yard waste bins on Monday night and putting them back on Tuesday. His sister, Finley, created a flyer for him (free of charge!), and he’s already signed up six neighbors on our street.

Let’s say our street was America Avenue, and Everett’s buddy started a similar business on Foreign Drive. Right now, America Avenue has a lot going in its favor: the homeowners have disposable income, there’s low traffic, and they’re willing to humor kids. Foreign Drive has a little more traffic, the houses are more spread apart, and with more stingy neighbors.
Because of this, when Everett and his friend decide to sell their businesses to the next generation of middle school kids in a few years, the America Avenue business might sell for more.
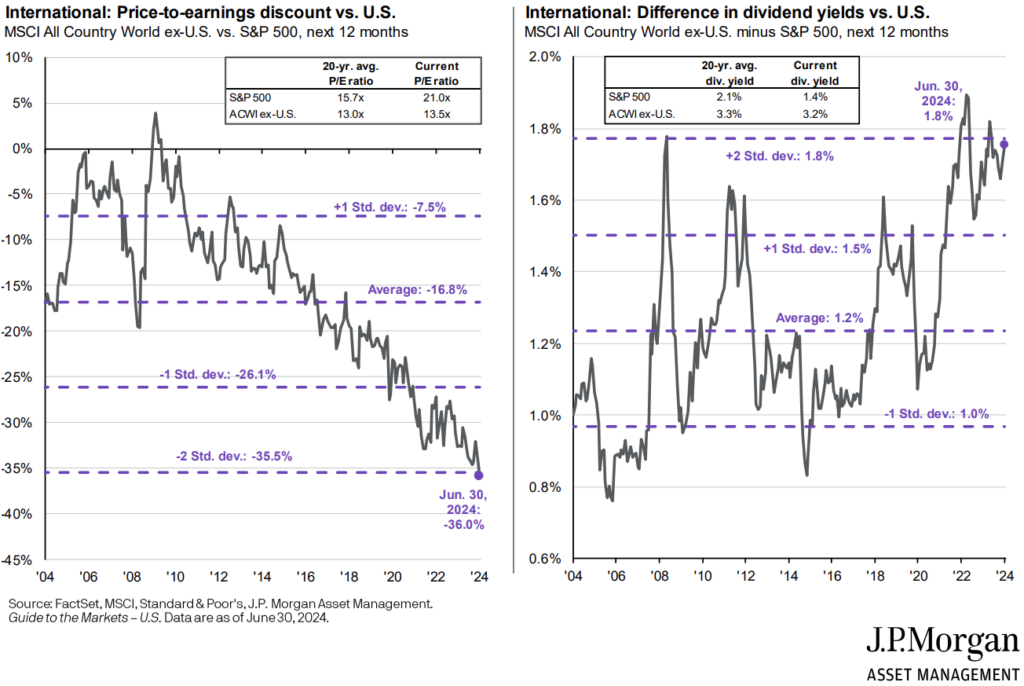
Over the last 20 years, US stocks have sold for an average of 15.7x of their earnings (P/E ratio). This means investors have been willing to buy US stocks for $15.70 for each $1 of the companies’ earnings. On the foreign side, investors have only been willing to pay $13.00 per $1 of earnings. This 16.8% average discount on foreign stocks represents investors’ expectations about owning a foreign business versus a US business (which includes assumptions about growth rates, copywriting law, political stability, etc.)
The chart below (left side) shows that this discount has widened since the global financial crisis of 2008-2009, when foreign stocks commanded a premium. Today, investors demand a whopping 36% discount, two standard deviations outside the 25-year norm.
In terms of the trash pandas, Foreign Drive might have more traffic and stingier neighbors. But if a kid can still earn $6/week in the same amount of time and effort, is that business worth 36% less?
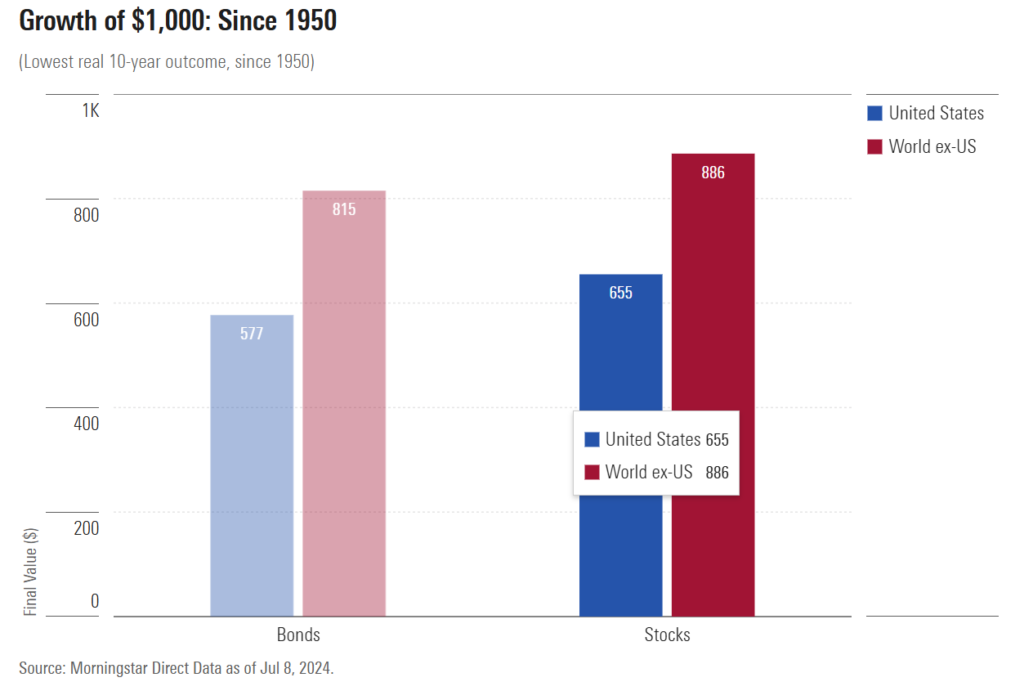
Furthermore, Foreign Drive might provide better “bad” returns than American Avenue. Morningstar’s John Rekenthaler summarized research examining the worst ten-year periods for foreign and domestic stock returns over the last 74 years. The results show that over their worst ten-year period, $1,000 in US stocks shrank to $655, while foreign stocks only decreased to $866.
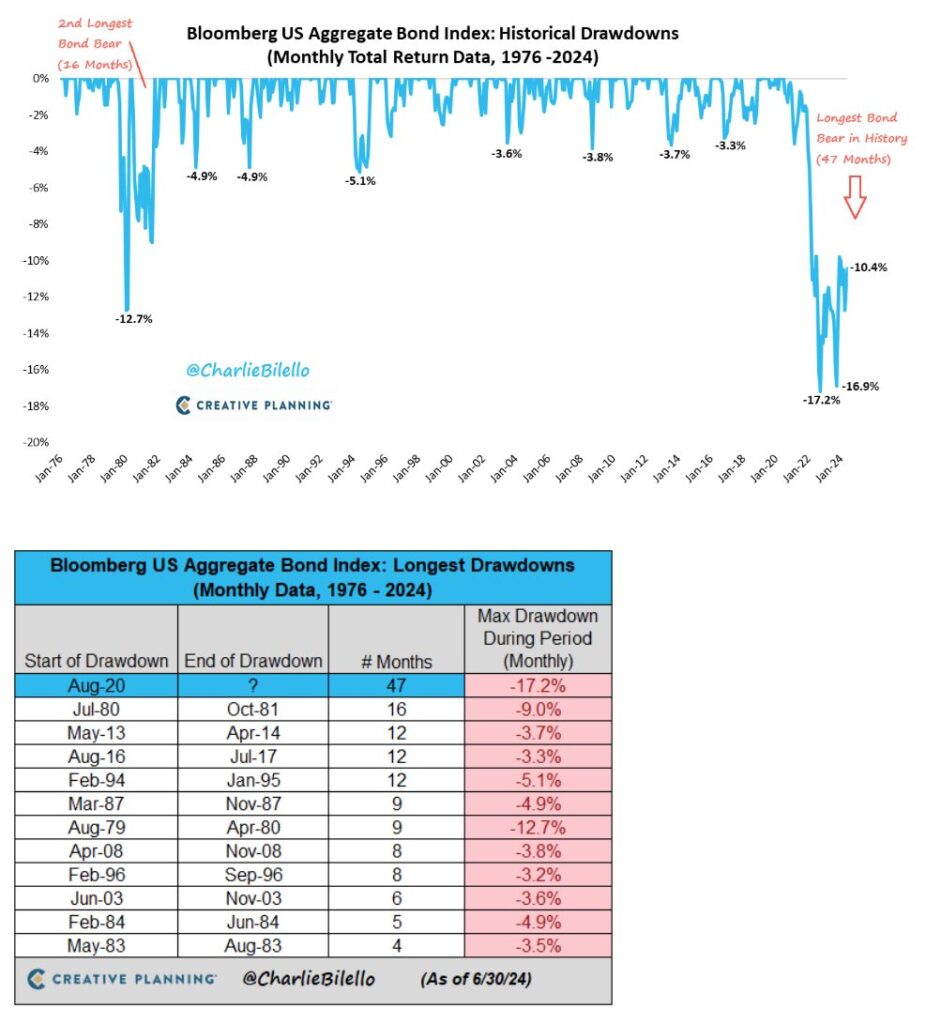
On the bond side, the story also repeats itself. Even while inflation slows and the economy grows, the Fed hesitates to cut rates. As Charlie Billelo’s charts below illustrate, we all have the privilege of telling our grandchildren that we lived through the longest bond bear market in modern history by three times! Of course, I can’t think of a more boring story for a grandchild to hear, but that has never stopped grandparents before.
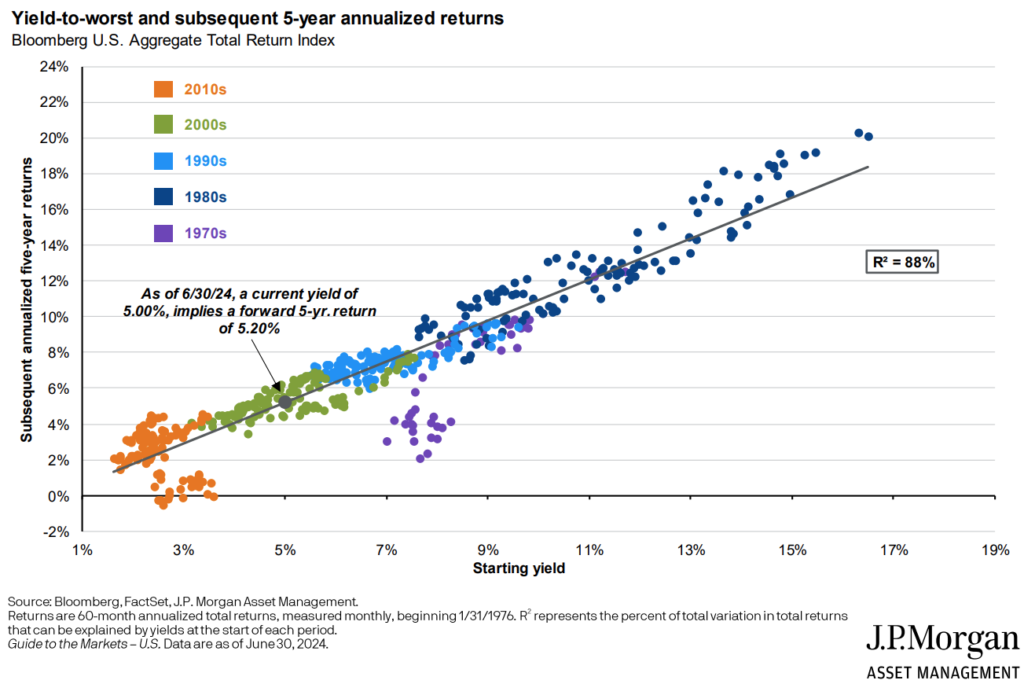
The flip side of the high-rate coin is that 5-year historical returns are tied closely to initial yields (as seen below). Of course, there are exceptions. Investors have “started” with higher rates than today and ended up with below-average returns (see the 1970s purple dots below the trendline). Still, the trend favors a positive relationship between starting rates and 5-year realized returns.
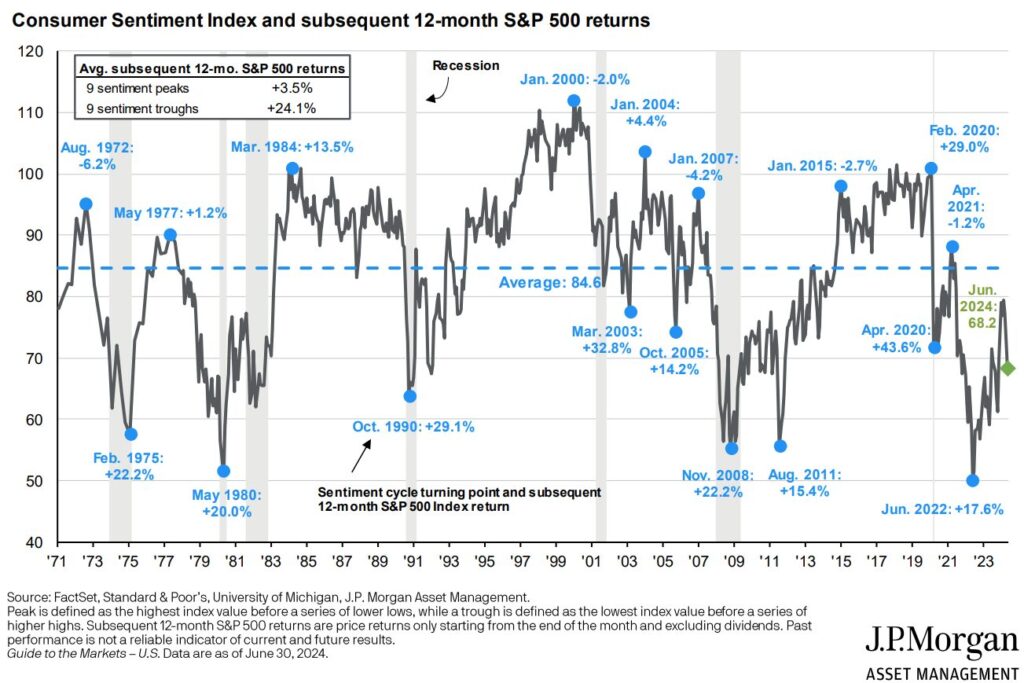
Even with markets at all-time highs, consumer sentiment is still in the troughs. Consumers are less optimistic than at any point during the COVID shutdown! When sentiment is low, forward returns are typically higher (and vice versa).
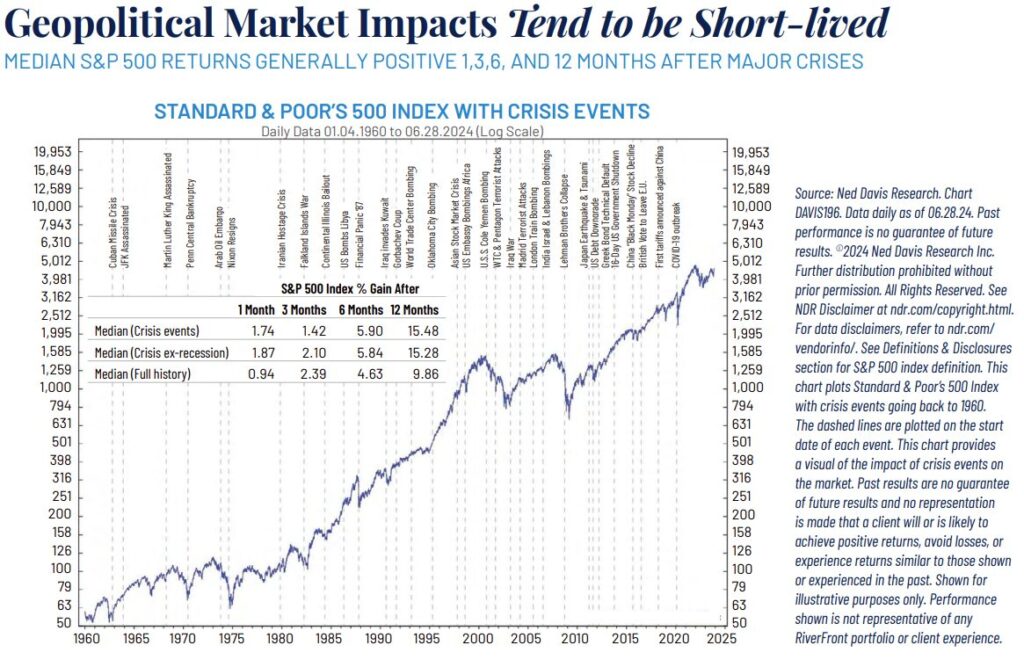
There is a lot of uncertainty ahead in the coming months: the election, investment markets, inflation, interest rates, geopolitical conflict, or any number of events we don’t even know to worry about yet. But history is a good guide for what is to come. Over the last 65 years, investors in the S&P 500 have lived through many once-in-a-lifetime events. RiverFront Investment Group’s chart below highlights the market’s resilience to these events.
