Quarter in Charts – Q1 2024
“Dad, our lawn looks like the Masters!” That’s an actual quote from our eleven-year-old son last weekend.
When we moved in 12 years ago, the backyard was a jungle without a blade of grass. But over the years, we’ve slowly transformed it to allow us to host countless parties and backyard football games. It has seen drought, flood, fallen trees, and a thousand miles from a Jeep Power Wheel. It is hard not to see some lessons and similarities between my lawn and the current market.

“Nice Looking Lawn Mr. Jones!”
That Masters comment from my son might not be as out of left field as you might think. He was probably just trying to butter me up. You see, I’ve told all our kids that when they go to a friend’s house, they should tell their friend’s dad how great the lawn looks. This doesn’t mean they should say it looks good if it doesn’t (they can keep that comment to themselves!) But if it looks good, a “Nice looking lawn, Mr. Jones!” goes a long way if they ever accidentally throw a baseball through Mr. Jones’ window.
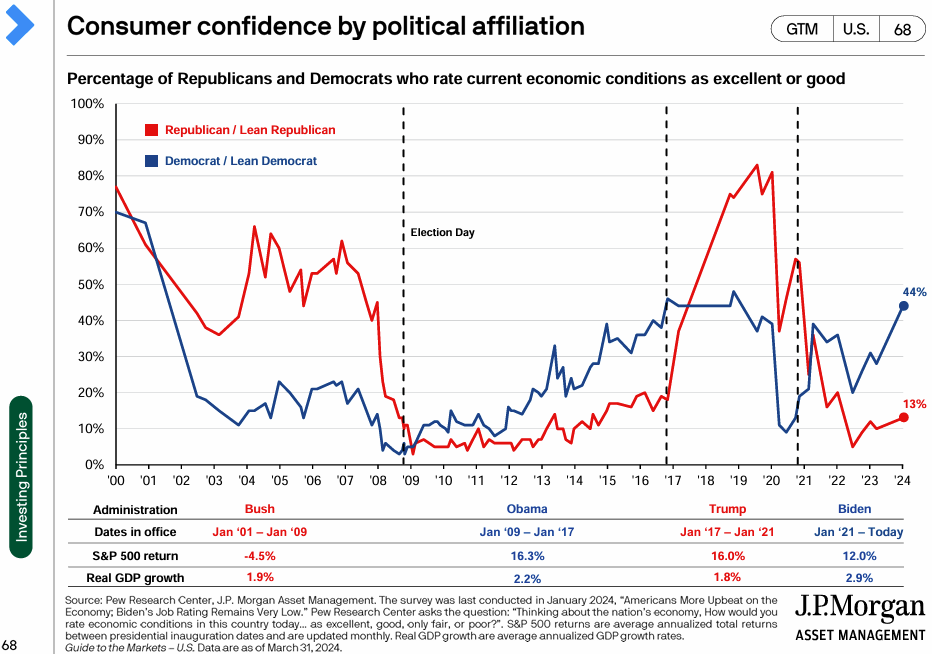
I trained our kids to look for greener grass on the other side of the fence, but Americans seem trained to see the opposite. Over the last 25 years, the Pew Research Center has surveyed Republicans and Democrats about the current (not “expected future”) economic conditions. It isn’t surprising that respondents saw green grass suddenly turn brown (or vice versa) in November of 2008, 2016, and 2020.
I Might Not Want Two Lawn Guys
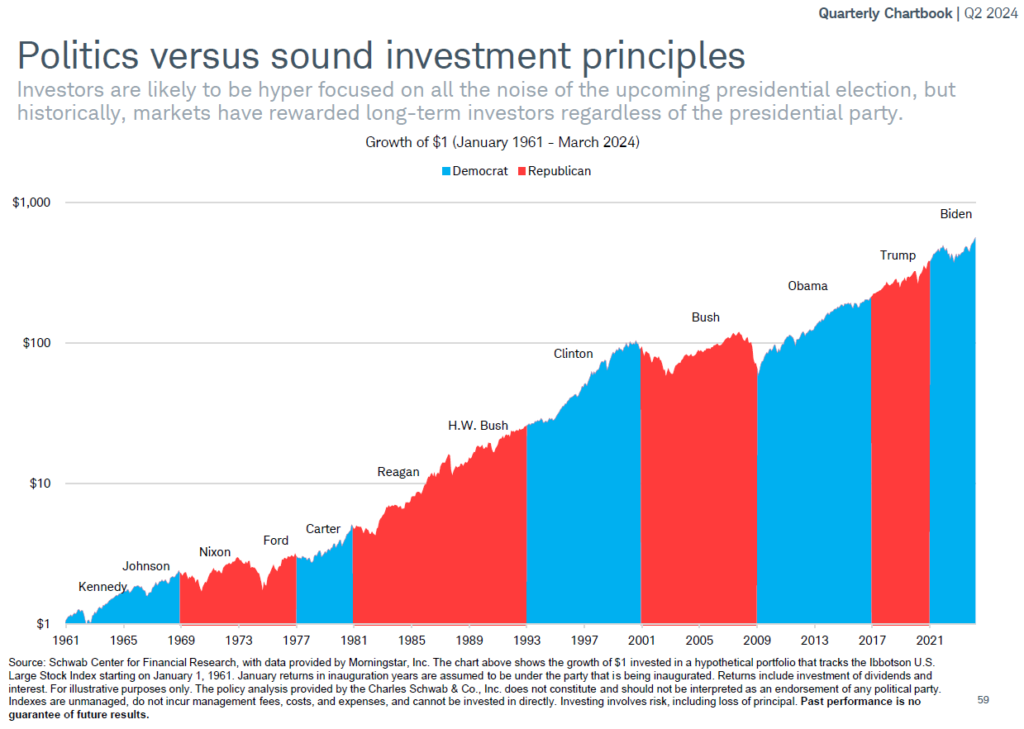
As we head into election season, most people have an opinion about who they would like in Congress and the Oval Office. In the short term, Mr. Market is certainly one of those people too. But over the longer term, he seems to be bipartisan. The chart below highlights the Large Stock Index returns between presidential inaugurations. While each of these presidents had their influence on policies, positions of power, and even the tone of the country, none had complete control of the economy or the stock market.
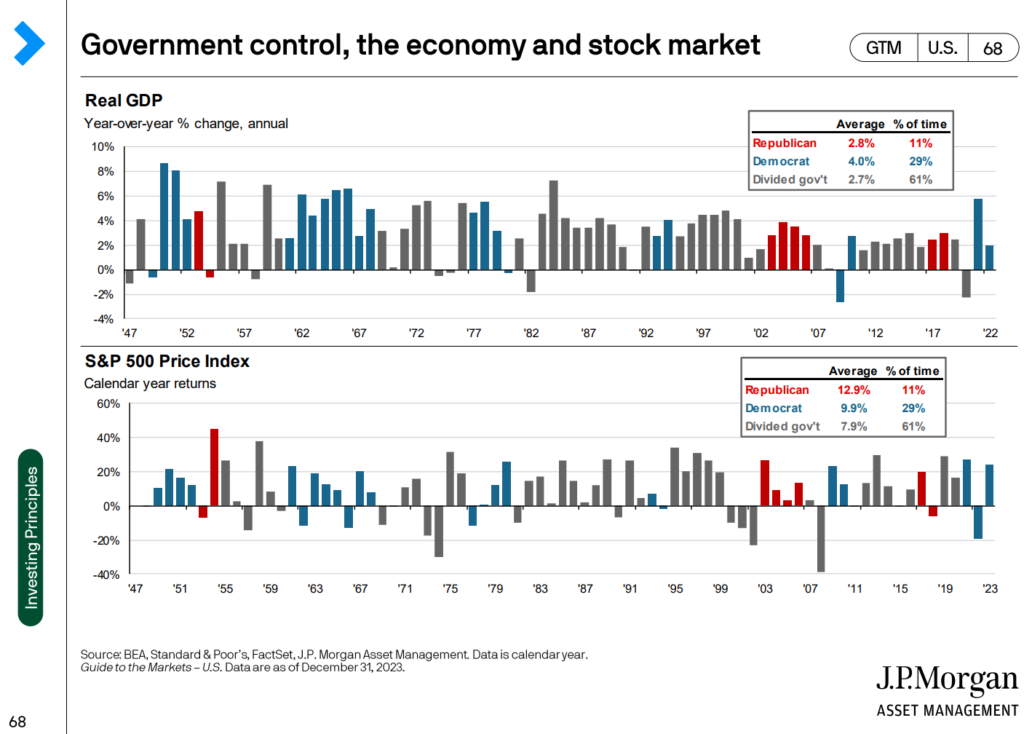
If we want to draw any conclusions about the influence of government on the economy and the markets, we’d be better served to examine the degree of division within our government. The first chart below shows the growth in GDP since 1947 under unified Republican, Democrat, or Divided control. When Democrats held the legislative and executive powers (29% of the time, blue bars), GDP grew 4.0%; when it switched to Republican control (11% of the time, red bars), GDP slowed to 2.8%. When it was divided (61% of the time, gray bars) GDP was slightly lower at 2.7%.
However, the opposite dynamic was true of the S&P 500. Under Republican control, the S&P 500 grew 12.9% annualized versus 9.9% under Democrats. When the power was divided, growth was only 7.9%.
This dynamic makes sense, at least in the context of my lawn. Over the years, I’ve used two different lawn guys to seed and fertilize. One told me to mow it however short I wanted, bag the grass clippings, and he would spray for weeds. The result? My lawn looked great. The other lawn guy told me to mow it high and not bag the clippings because the tall grass would kill off the weeds. The result? Also great.
But what if I hired both lawn guys to figure out one plan? My lawn might grow high with weeds and not get any seed while they filibustered about how they would tackle my yard. That divided government has been the case for most of the last 77 years, and the American lawn (in terms of GDP and the S&P 500) has looked pretty good.
Is This as Good as It Gets?
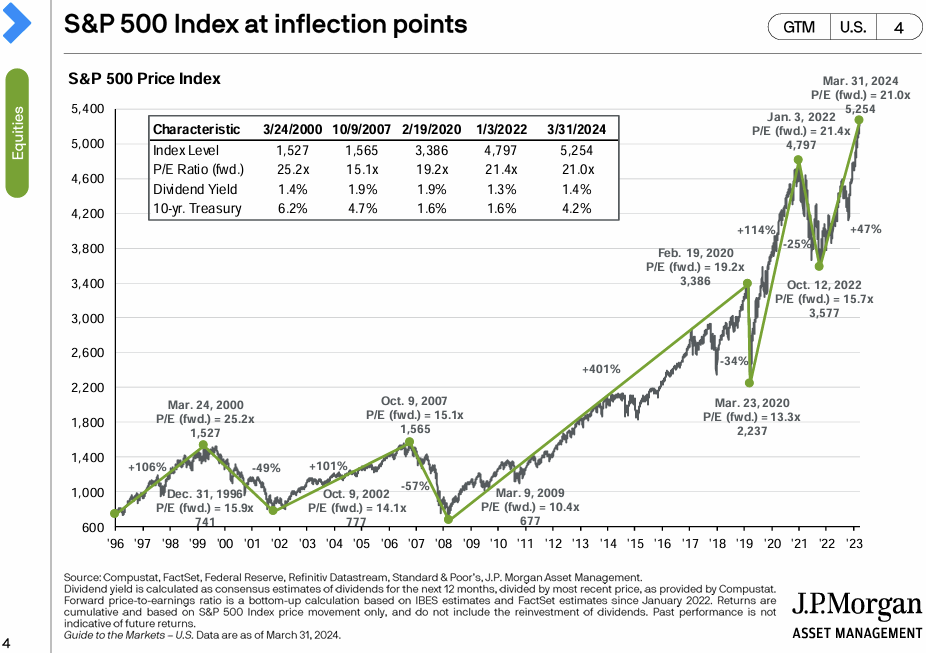
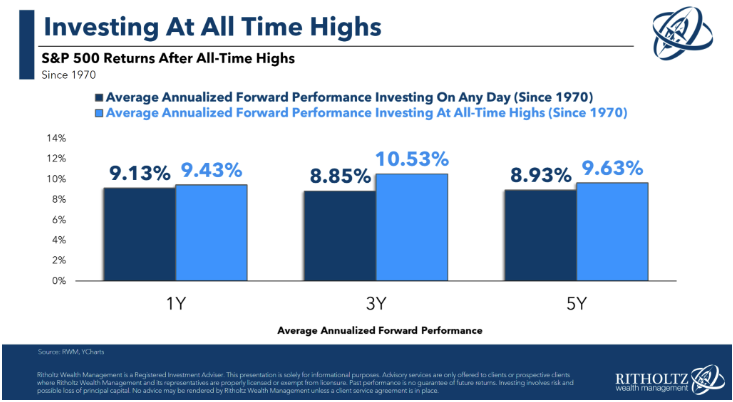
With cool temperatures, plenty of rain, and a healthy dose of fertilizer, it’s easy to feel good about my lawn in April. But will that always be the case? After the S&P 500 dropped -25% from January to October 2022, the index rebounded +47% to a new all-time high in March 2024.
So, are these all-time highs a reason to be worried? Intuition would say yes, but the data would suggest otherwise. Ritholtz Wealth Management explored this relationship with recent posts by Michael Batnick and Ben Carlson. The chart below from Batnick shows that since 1970, investors actually did better in 1, 3, and 5-year periods when they bought at the all-time high versus buying on any other day.
Drought Makes Strong Grass
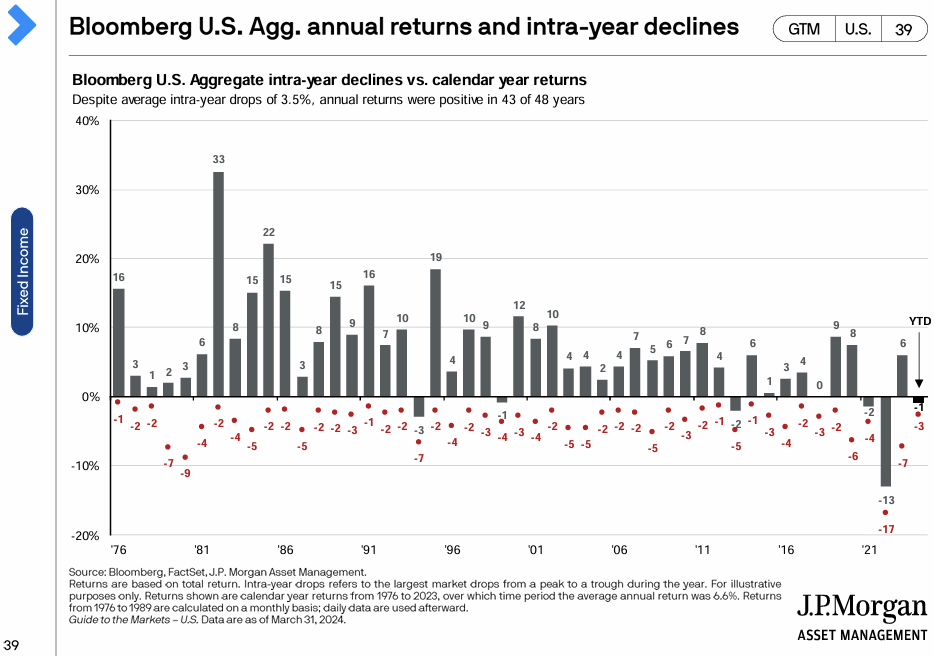
My lawn guy, Skinny, freely gives out lawn wisdom whether you want it or not. One afternoon, Skinny explained that if you water an established lawn a little every day, you’re effectively training the roots to be shallow. But if you water heavily once a week, you’ll train your grass roots to reach down deep for water. All-time market highs don’t always lead to more all-time highs. We should expect downturns like we experienced in the stock and bond markets in 2022. As counterintuitive as it seems, the potential for downturns is the reason stock returns tend to be higher than bond returns, which in turn tend to be higher than money market returns. The two charts below illustrate this.
Since 1976, US Aggregate Bonds earned +6.6% annualized returns while experiencing intra-year declines of only -3.5% and only five down years (two of those being 2021 and 2022.)
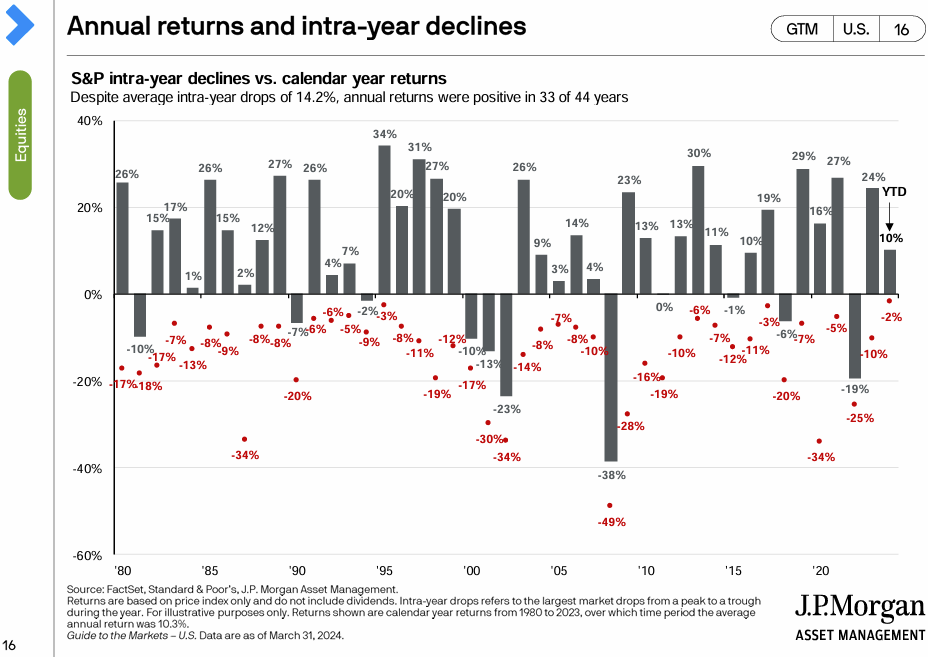
Over a nearly identical time period (since 1980), the S&P 500 has experienced +10.3% annual returns, but investors had average intra-year “droughts” of -14.2% even in the positive years! Furthermore, in 25% of those years, S&P 500 investors had barren lawns!
Survive and Advance
Our kids’ school does a Men’s NCAA bracket every year, and the stakes are high! The winner gets a Chick-fil-A lunch (with a milkshake) hand delivered by the principal. Every year, there are a lot of students who choose only the higher-seeded teams with very few upsets. Those kids always do okay (certainly better than me!) but never win. Higher seed teams are the Bond Funds of the NCAA bracket: very likely to go far and unlikely to lose to a 16 seed.
According to The Washington Post’s Neil Greenberg, to win the “office pool,” you need to take some risk and have a bit of luck because there is only one winner and no downside in losing. The lower-seeded teams are the Stock Funds of the NCAA bracket. A little research and a lot of luck could take you far.
This year, luck came in spades for our 11-year-old, Everett. His biggest stroke of luck was to be born an NC State fan (I’m pretty sure that’s the first time that sentence has ever been written.) He picked NC State to make it to the Final Four, nailed the tie-breaker score within one point, and felt like a king for a lunch period.
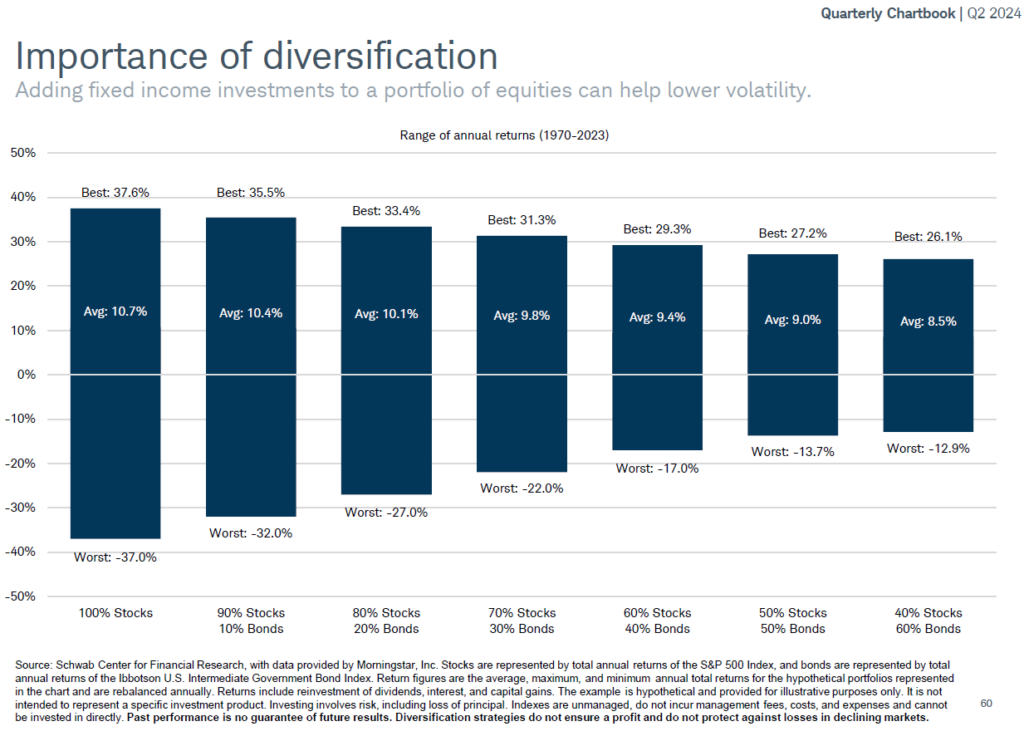
An “NCAA office pool” strategy has a time and a place in the Retirement Bracket. The chart below illustrates the best, worst, and average annual returns for various allocations of Stocks and Bonds. Investors can typically afford to take some risks in the early rounds of investing since the stakes are lower. But as we advance, we must remember there isn’t only one winner. Moving from left to right in the chart below, we see that portfolios that took on less risk earned slightly lower returns but experienced more palatable bad years. An ideal portfolio allows an investor to earn sufficient returns while sustaining manageable losses. Some might say the goal is to survive and advance.


Justin Smith
Latest posts by Justin Smith (see all)
- Tariffs and a Declaration of Parental Independence - April 11, 2025
- Quarter in Charts – Q1 2025 - April 11, 2025
- Quarter in Charts – Q4 2024 - January 22, 2025