Quarter in Charts – Q3 2024
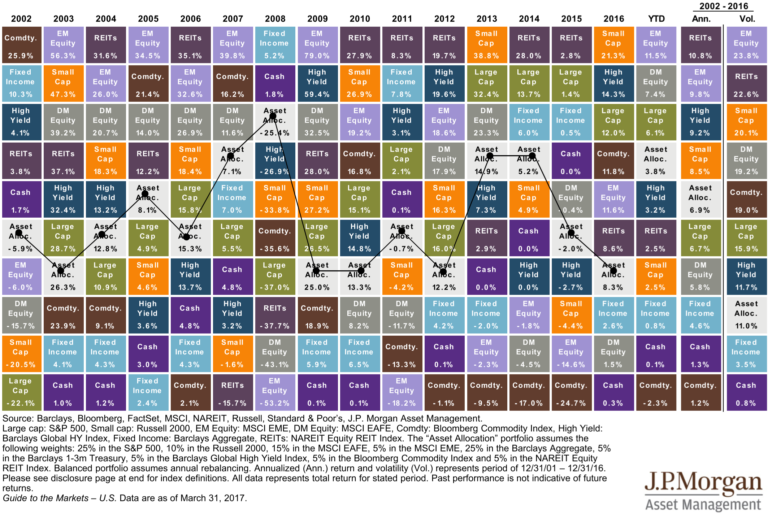
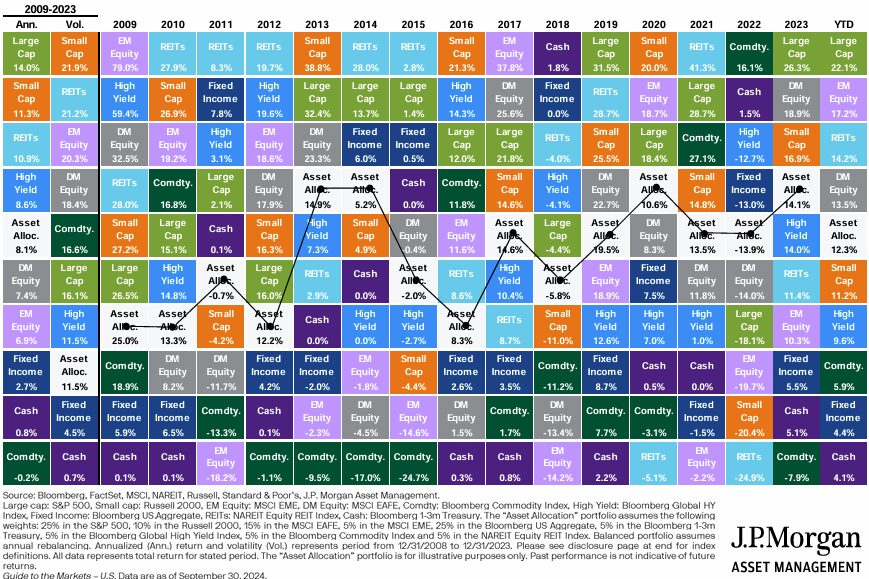
2024 is shaping up to be one of the rare years with no major asset class in decline (see far right column in the chart below.) Large Cap US, Foreign Stocks, and Real Estate have led the way, while Bonds and Commodities have returns barely more than money markets. Below, we will detail the relevant market drivers and close with a word on the election and the fight between pessimism and optimism.
After declining 25% during the nine-month 2021-22 downturn, the S&P 500 has rebounded 61% in the face of persistent inflation, high interest rates, and international conflict. Now that we’re two years removed, that downturn could seem like a fever dream. You might not remember how it felt: “That little red blip wasn’t so bad, was it?” If you’re up for a trip down memory lane, I encourage you to read our Q3 2022 commentary.
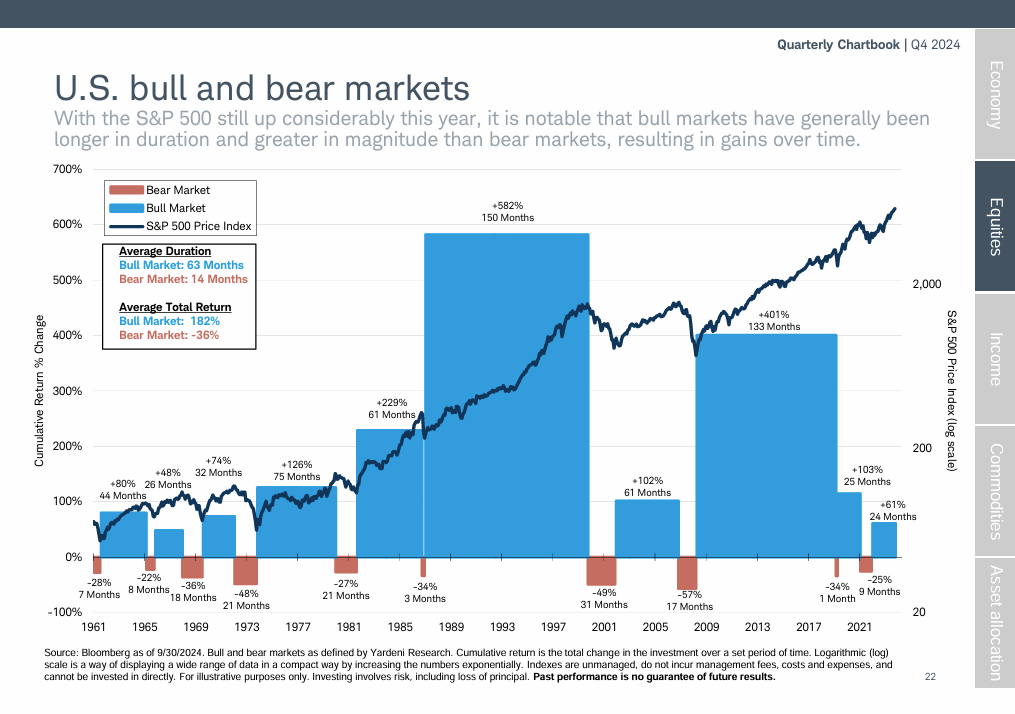
I highlight our old commentary because it was a time of little optimism. Our encouragement then was to step back and see the bigger picture: plan for continued downturns but expect the market to behave similarly to how it has for the last century. This 2022 pessimistic time period is the most recent low point in the investor sentiment chart below (see extreme pessimism box near 2022).
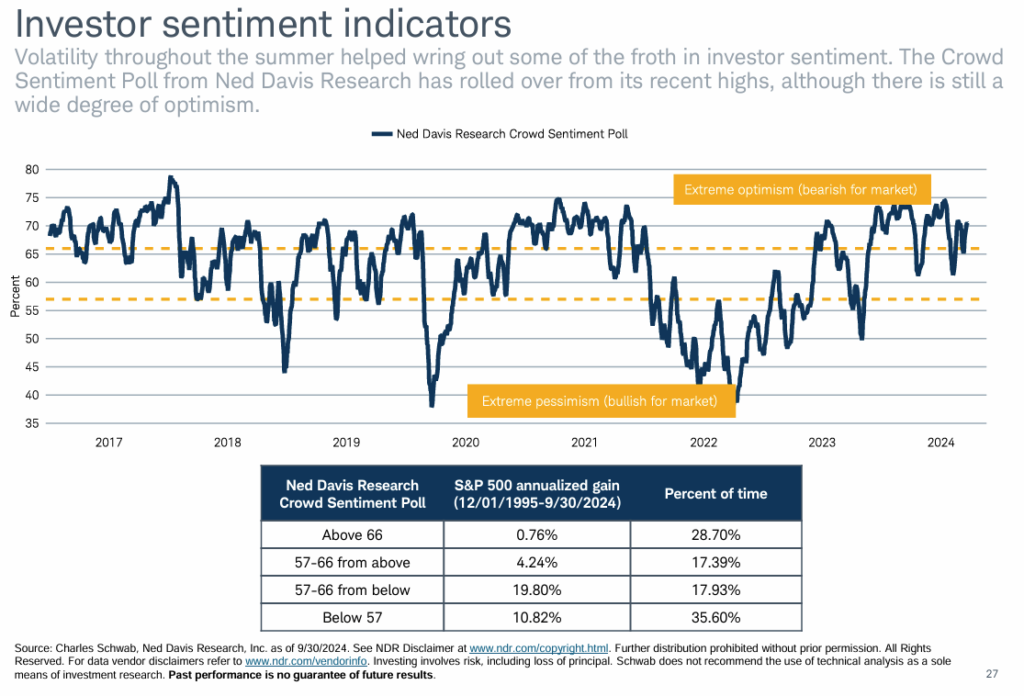
Today’s US stock market is nearly at the other end of the spectrum (see the extreme optimism box in the chart above.) Schwab’s research is limited to the last 30 years, but when we look at other periods when investors have been this optimistic (see the Above 66% row), forward investment returns have been nearly flat.
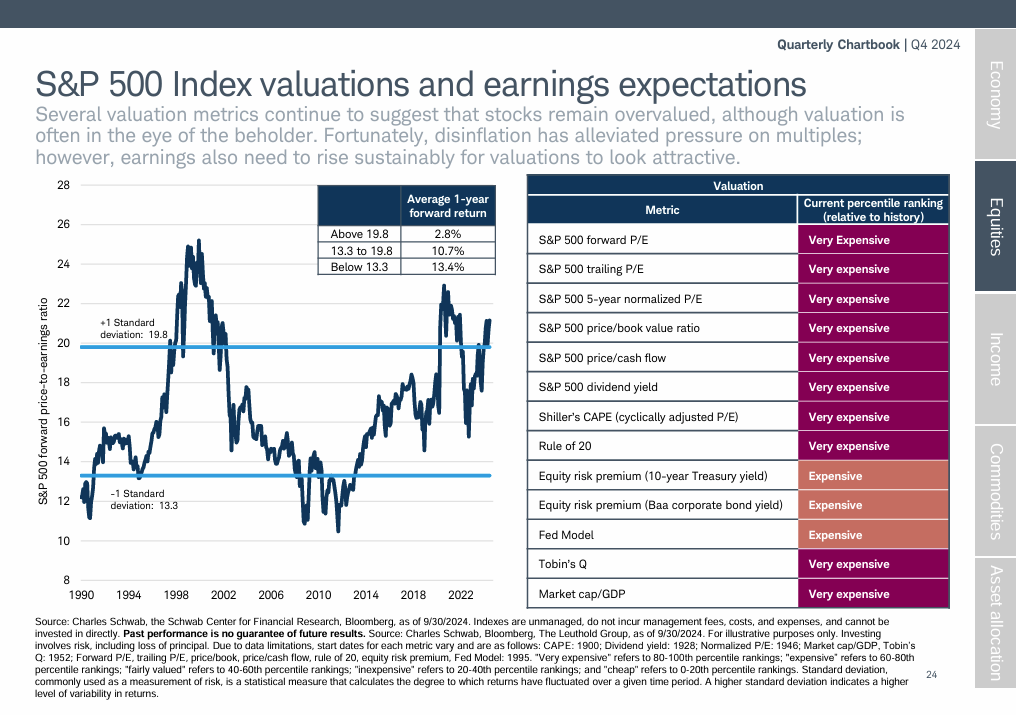
The above is based merely on sentiment (how investors feel about the future.) The data below shows that investors are backing up that sentiment with the prices they are willing to pay. The S&P 500 is currently in the 80-100th percentile range (very expensive) on 10 different valuation metrics (see chart below on the right) and in the 60-80th percentile (expensive) on three of the metrics. Over the last 35 years, the S&P 500 has only been this expensive twice: during the Dot-Com bubble and the run-up before the 2021-22 downturn.
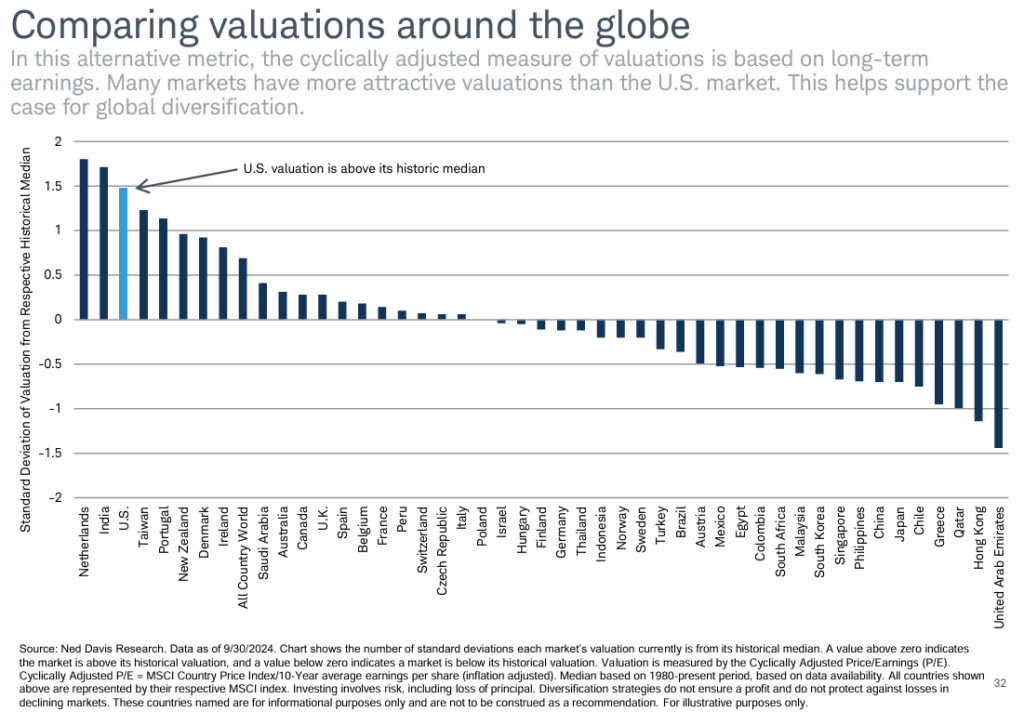
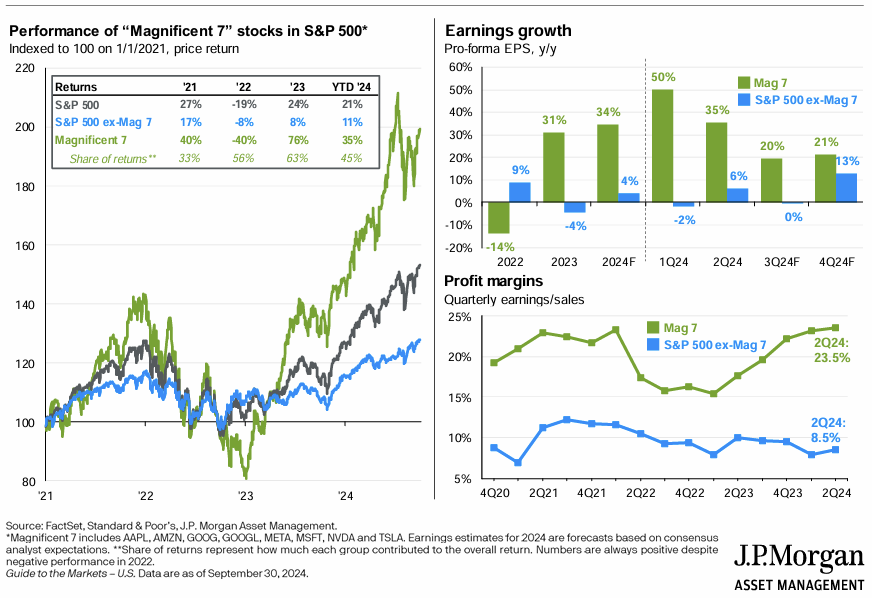
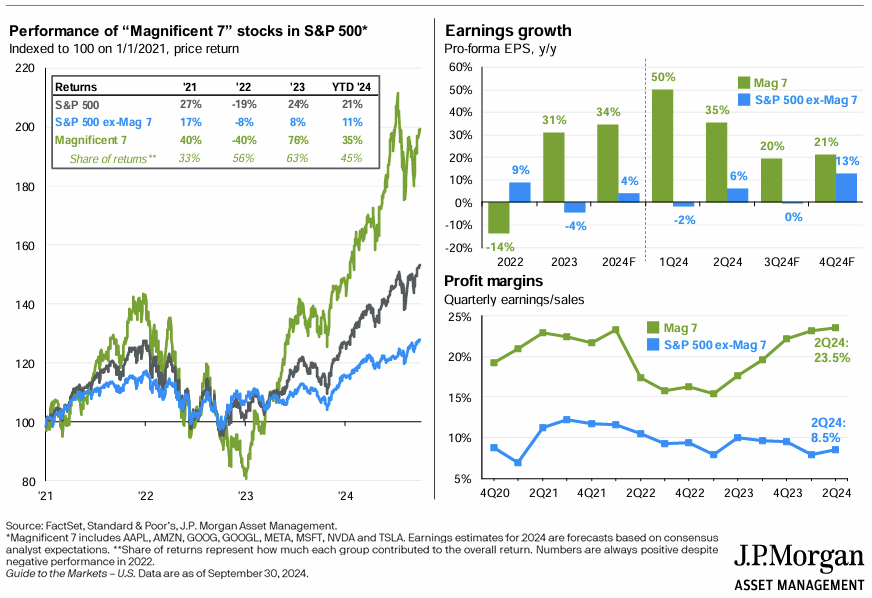
So, does this spell trouble for the overall world market? Not necessarily. There’s a saying that goes something like, “Between Michael Jordan and me, we’ve won 6 NBA Championships.” The joke is that MJ has won six and I’ve won zero. The same goes for our current equity market. World Equity markets look expensive, but much of that is because US Stocks are expensive relative to Foreign Stocks (see chart 1 below). Drilling down further, US Stocks are expensive because they are dominated by US Growth Stocks, which are currently expensive relative to US Value Stocks (see chart 2 below). At an even deeper level, the Magnificent 7 Growth Stocks account for nearly the entire US Growth market (see chart 3 below.) In other words, “Between the Magnificent 7 and the rest of the market, we’ve had some great returns.”
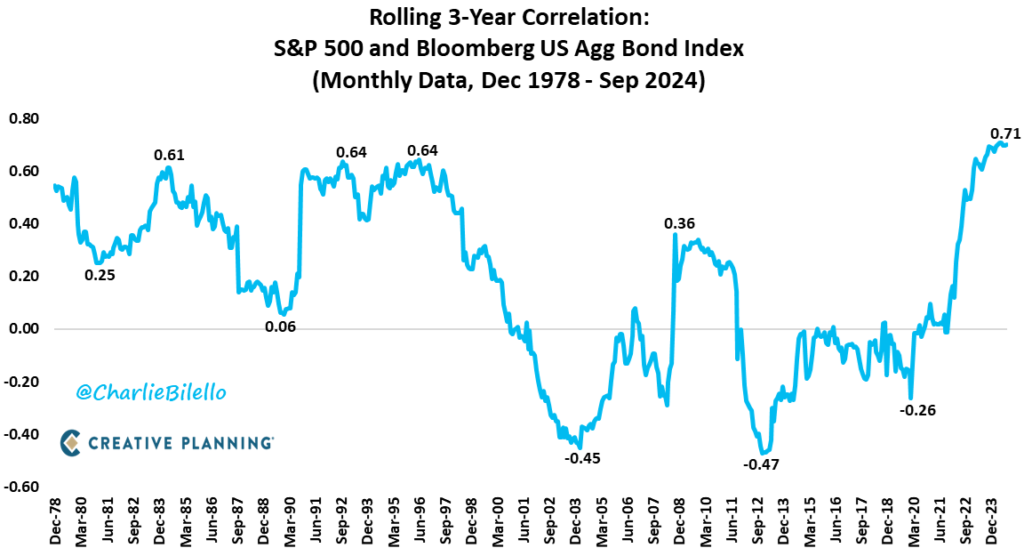
For investors concerned with lowering their risk, Bond markets are recovering, albeit slowly, from their historic 2021- 22 decline. Correlations (how often stocks and bonds move up or down together) are returning to more historical norms, pointing to bonds’ importance as a diversification tool going forward.
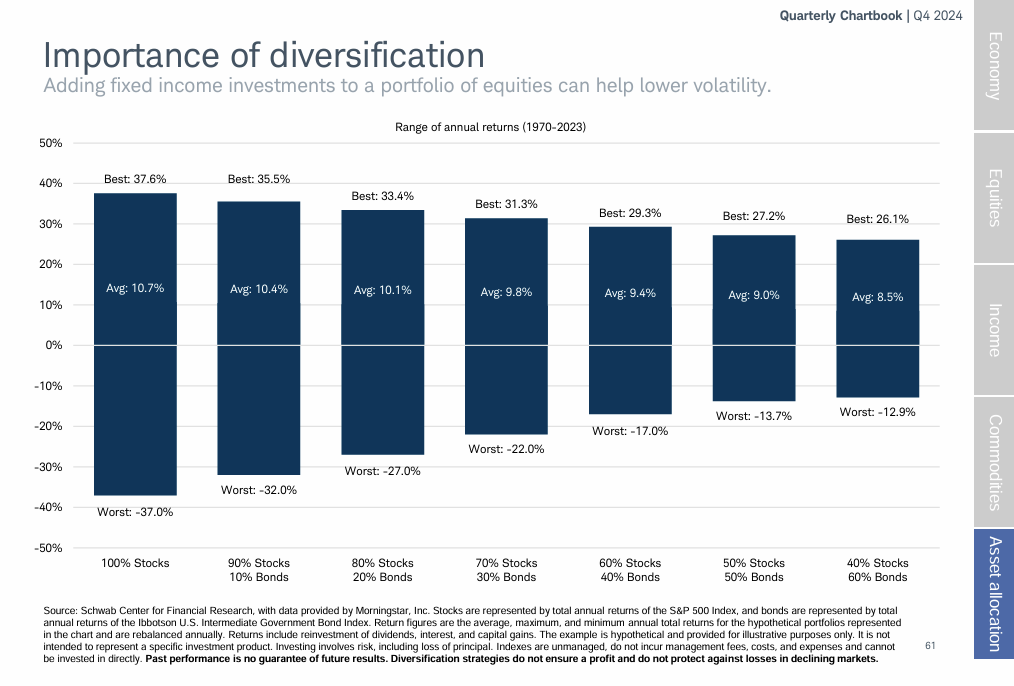
Now that bond yields are higher and inflation concerns are abating, bonds will likely resume their role as a long term source of lower volatility returns. The chart below shows the important impact of varying levels of bonds throughout the last half-century.
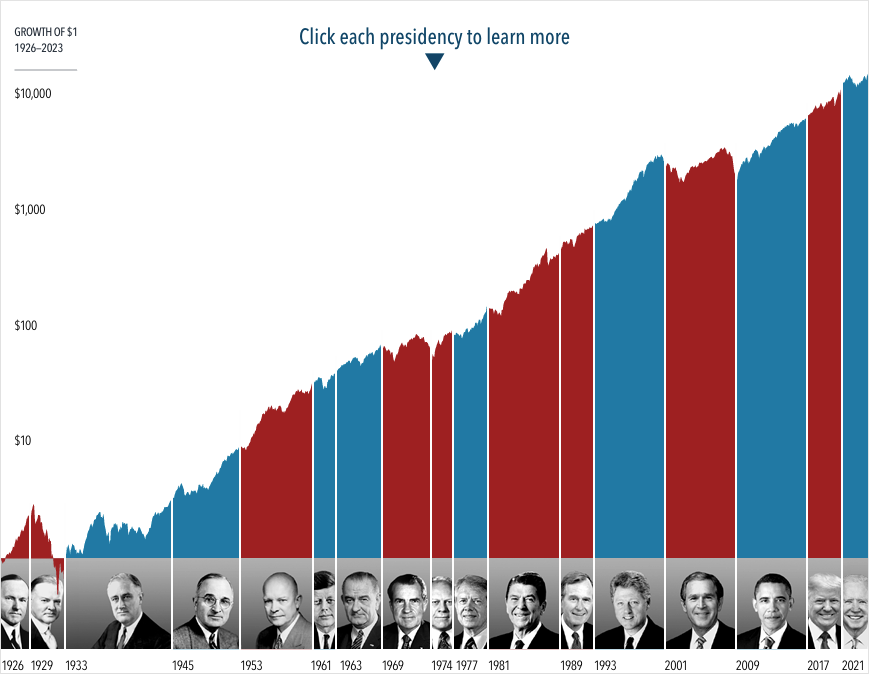
A final note on the upcoming elections. Dimensional Fund Advisors has an interesting resource highlighting the US Stock returns for the last 100 years (after clicking the link, you must choose “individual investors” to see the data.) When you choose different time periods, you’ll see the details of each president’s term with the congressional makeup, highest unemployment rate, GDP growth, inflation, and deficit.
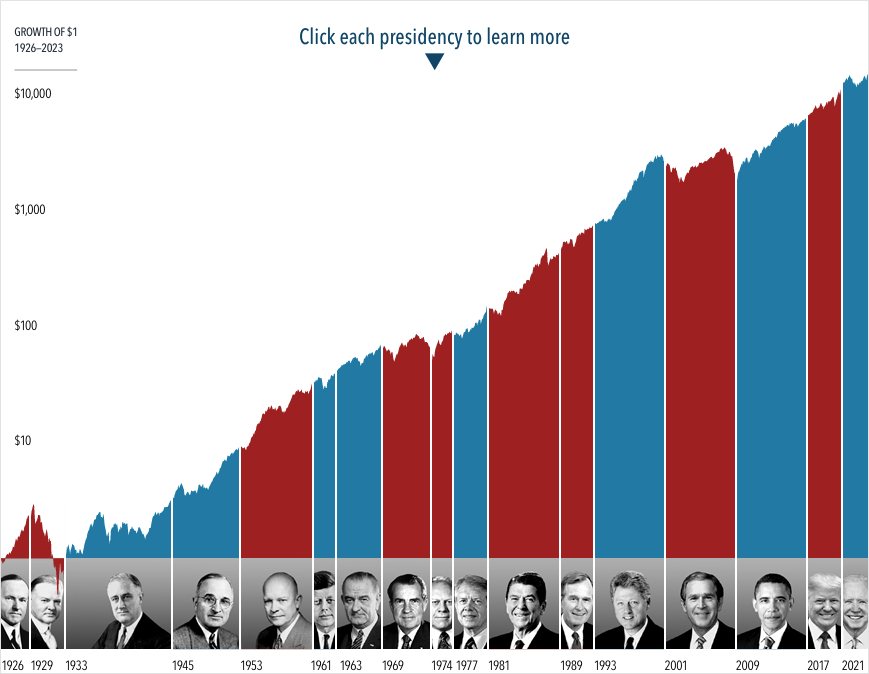
I found the “worst” data to be the most interesting. Over the last 50 years, every president presided over a period with at least 6% unemployment. Six out of the last 10 presidents were in office during an average inflation rate north of 4%. We’ve had war and peace, recession and expansion, deficits and surpluses. We had a “lost decade,” a “great financial crisis,” and several corrections. And still, the equity market grew over time.
As far as investing is concerned, it is far easier to worry about the future than to feel hopeful, especially if your candidate and/or party is not elected. (Note: I know that most voters have concerns far higher on the priority list than “investment returns,” but thankfully, this is a market commentary, not a social or political commentary.)
In his blog post, The Seduction of Pessimism, financial author Morgan Housel points out the uphill climb it takes to be an optimist, “Pessimism can be hard to distinguish from critical thinking and is often taken more seriously than optimism, which can be hard to distinguish from salesmanship and aloofness.”
Housel goes on to describe how our timeline should play into our views,
“The difference between pessimism and optimism often comes down to time horizon. If a recession or downturn is the end of your show, you should be pessimistic. If it’s a bad commercial during an otherwise great episode, you should be optimistic.
Since short-term shocks are more frequent and recent than long-term gains, pessimism usually sounds smarter than optimism because it’s easier to recall.
Optimists are often ridiculed as being oblivious to how risky the world is. I’ve found this to be a bad reading. They’re often quite aware of risks, but equally aware of risks being the soil optimism eventually grows out of.”
I echo Housel’s take on long-term optimism balanced with short-term pessimism. We explained this dichotomy in our blog post about Understanding Probabilities of Success. There are healthy ways to be pessimistic about arriving at a wedding on time, such as purchasing a AAA membership, mapping out the route ahead of time, and planning to arrive 30 minutes early. But there are also unhealthy ways: planning to arrive five hours early, carrying four spare tires, or driving 100 miles per hour. This is where a personalized financial plan comes into play. Google Maps can tell me when I should leave, but it doesn’t know how bad I am with directions, how much gas is in my tank, or if I’m the groom or just a random attendee. Those factors play a large part in my trip planning, just like your personal goals and history should play a factor in your financial plan.
