Quarter in Charts – Q3 2022
Over the last few weeks, I kept the kids up far past their bedtimes to witness Aaron Judge break the American League single-season home run record. While we had to sit through a whole lot of walks, we eventually got to witness a once-in-a-lifetime event that we’ll tell some grandkids about. Sadly, this year, investors have also witnessed an investment market for the record books. Through the charts below (and a recounting of my real-world experience with our 15-year-old new driver) we’ll examine the year so far, talk through viewing investments through the “windshield” of a financial plan, and see how investors have typically fared better than average coming out of historic times like these.

Below is a chart from Charlie Bilello detailing the S&P 500 (US Stock) and 10-year Treasury (US Government Bond) returns since 1928. The yellow cells highlight the years when stocks and bonds were negative (or 0%) for the year. If 2022 ended today, investors would have lived through only the 5th calendar year of negative stock and bond returns (this has happened in only 5.4% of the years since 1928.)
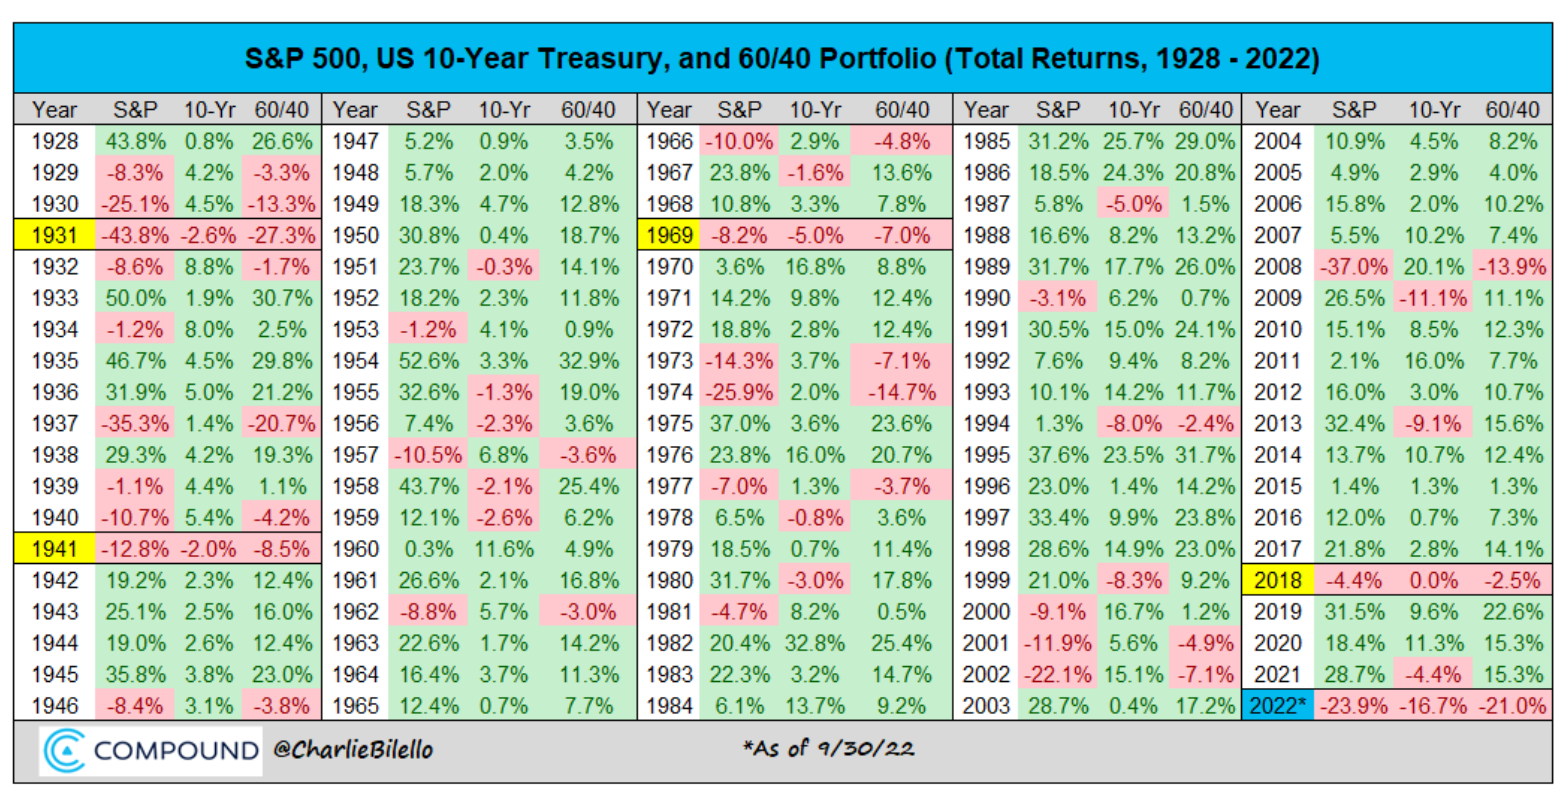
In the third column of each year, the chart above also shows the results of a balanced portfolio of 60% Stocks and 40% Treasuries. Note that for 2022 (the blue cell), the S&P 500 is down -23.9% and 10-year Treasuries are down -16.7% (this is their 6th worst and absolute worst years, respectively, since 1928.) The combined 60/40 portfolio is down -21.0% this year, which is the worst year since 1931 – a record (that no one wants to claim) 94 years in the making.
Record-Setting Rate Hikes
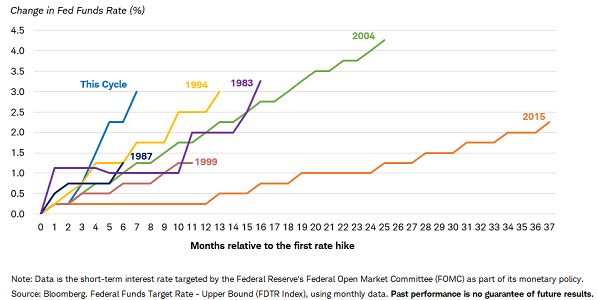
As high inflation has persisted over the last two years, the Fed has taken a record-breaking stance to reign it in. Compared to other rate hikes over the last 40 years, the recent cycle is by far the most aggressive (see chart above from Morningstar.)
As interest rates rise, bond prices fall. To demonstrate this, let’s assume that last year, I paid $1,500 for a bond that would pay me 2% annually ($30/year.) Fast forward to today. My neighbor has an opportunity to buy a similar bond that would yield her a much higher 3%. If I want to sell her my $30/year (2%) bond, I would need to lower the price from $1,500 to $1,000 to make my $30/year payments equivalent to the 3% bonds she could buy on the open market. Below, we can see the impact that these announced (and expected) rate hikes have had on the bond market.
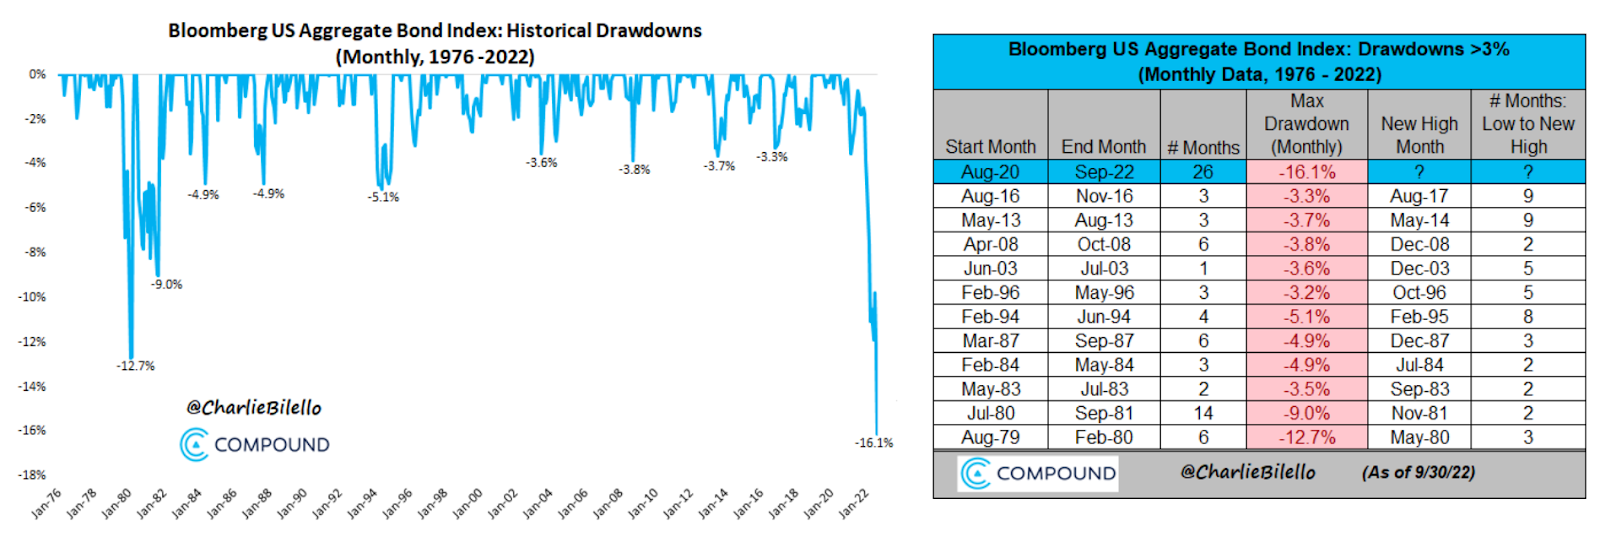
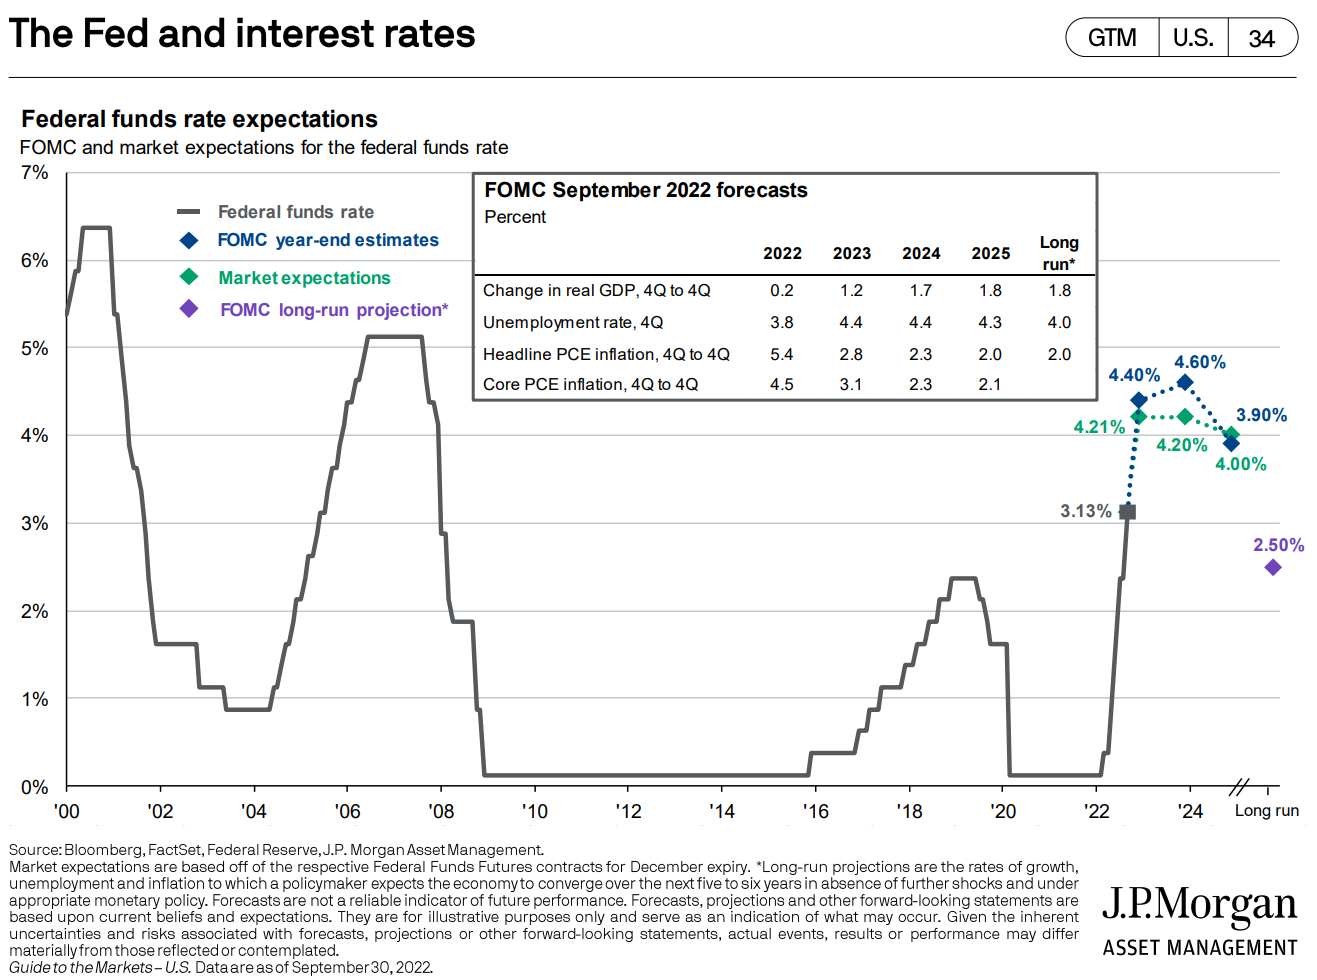
On top of the known rate increases, the Fed has indicated (and the market is already pricing in) another 1.00 to 1.50% hike over the coming year (dotted lines below.) If rate hikes are higher than what the market is already pricing in, we could see a further decline in the bond market.
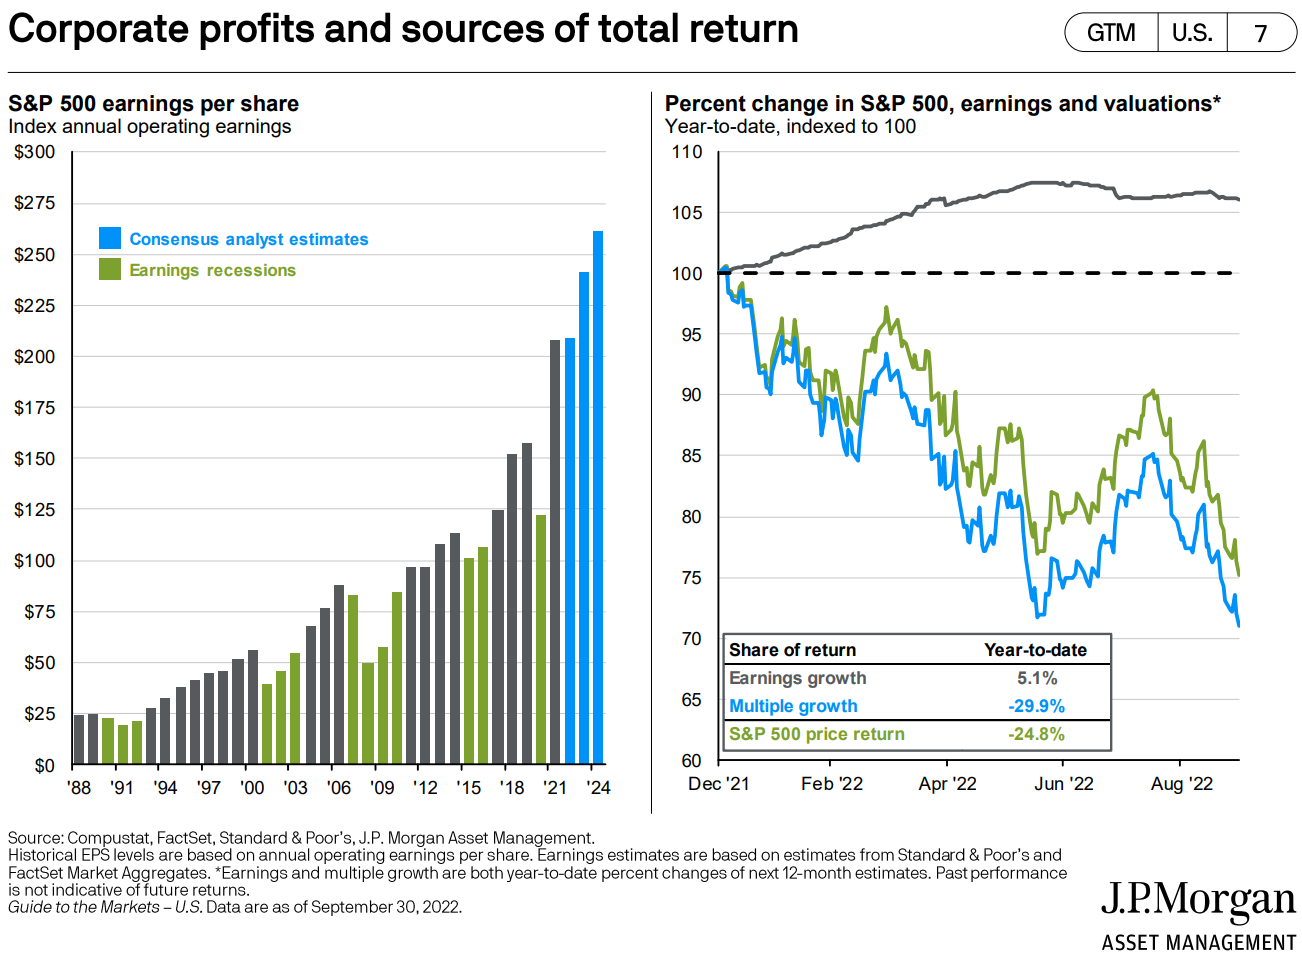
Stocks Also Hit by Rate Hikes
In simplest terms, stocks haven’t fallen because of declining corporate earnings (profits have actually risen 5% this year, see the gray line below.) Rather stocks have fallen due to declining expectations as seen in the 29.9% drop in the price investors are willing to pay for a dollar of Corporate Earnings (see the P/E multiple in blue in the chart on the right.)
Why the declining expectations? Again, we look at inflation and rate hikes. To keep inflation in check, the Fed uses higher interest rates (and other tools) to slow economic growth, often causing higher unemployment, slowing housing demand, decreasing corporate profits, and market declines.
What’s in the Rearview Mirror?
Our oldest kid recently turned 15 and got her learner’s permit. After a few car rides with mom, I officially became the designated parent in charge of overseeing Grayson’s 60 hours of supervised driving. She’s a really great driver, but we’ve had a couple of nerve-racking moments. When these happen, a new driver’s blood pressure rises, their speed drops, they get flustered, and they get much more cautious.

I’m all for caution behind the wheel. I want Grayson to look both ways before going through green lights even though the other cars should heed red lights. But I also know that too much caution and fear could cause her to become a more dangerous driver (i.e. maybe she perpetually drives 10 miles per hour below the speed limit or slams on the brakes instead of yielding on an exit ramp.)
Scary moments should serve to remind us how we should drive all of the time, not just in the 30 minutes after an incident. A driver who is appropriately cautious all of the time is a better driver than one who swings from being overly aggressive before an incident and overly cautious after an incident.
The same goes for investors. As much as we don’t like to look at the recent charts, the last 9 months are in our rearview mirror. And while we can’t foresee what is to come, we do know that plenty of bad news is already priced into stock and bond markets. We saw this in the bond expectations and the declining P/E multiples above.
In other words, the stock market’s rearview mirror includes 100% of what has already happened and 100% of investors’ collective short-term expectations for what will happen. The market is expecting (and has already priced in) an economic 4-car pile-up. We know this because 2022 is already the 6th worst and absolute worst year on record for stocks and bonds respectively (see the first chart again.) Of course, that expectation might be wrong. We don’t know if this time period in our economy will rival or surpass the Great Depression and wind up a 7-car pile-up (we don’t think it will) or if we’ll look back and see that all of this was just a fender-bender (we don’t think that will be the case either.)
What Can We See Through the Windshield?
The chart below, again from Charlie Bilello, shows how the Wilshire 5000 (a representation of the total US stock market) weathered its top 20 worst 9-month periods since 1971. All of those worst periods center around 1973-74, 2000-02, and 2008…and a new period that started in January 2022.
On the right side of the chart, we see what happened over the following 3 months to 10 years after these worst 9-month periods. At the bottom of the chart, we see the average returns coming out of these 20 worst periods compared with how all time periods (good and bad) have performed since 1971. Note, the only period with unknown forward returns is 2022.
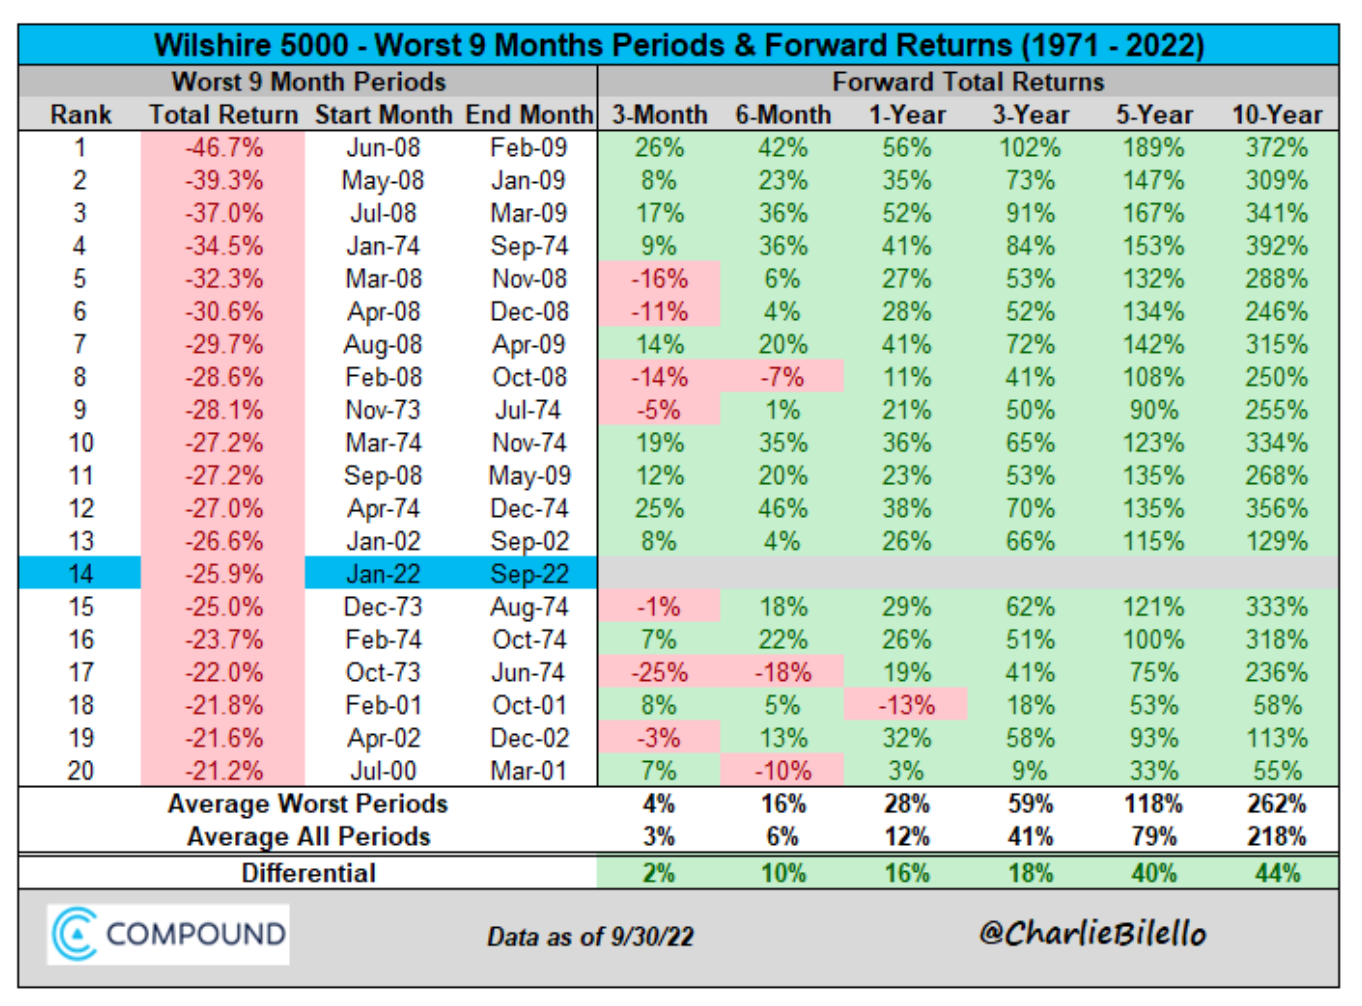
Focusing on the forward returns, some things stand out that are worth paying attention to:
- Variability in the Short Term: When we look at the 3-month periods, the market typically rebounded upward. However, 37% of the time, the market continued to go down. In real terms, after investors lived through 7 of the 19 worst 9-month periods, they endured further declines (ranging from -1% to -25%.) If we look out further to 6-month periods, we still see further declines occurring in 15% of the time periods, ranging from -7% to -18%.
- Consistency in the Mid to Long Term: As we’re able to look further out to 1, 3, 5, and 10 years we see overwhelmingly positive returns. In the words of Warren Buffett, “The stock market is a device for transferring money from the impatient to the patient.”
- Above Average Returns: Looking at the bottom three rows, Charlie Bilello highlights the average returns coming out of the worst 9-month periods since 1971 compared with the average returns for all time periods over the same half-century. On average, the end of a worst 9-month time period has been a great time to “start” investing for the next 1-10 years.
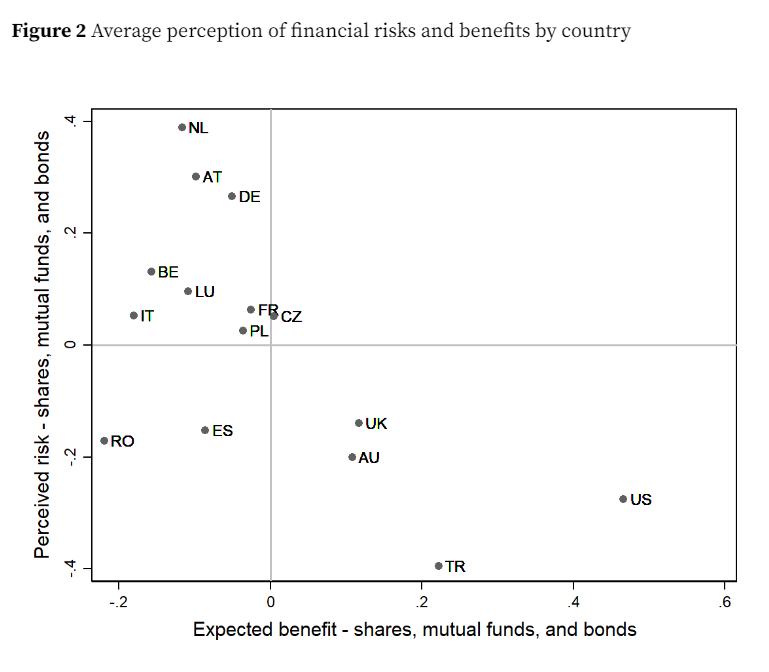
But if we traveled back in time to the end of any of these 20 worst 9-month periods, it rarely felt like a good time to invest. Why? Because our perceptions of risk and return often don’t match up with the most likely reality. Economist Maria Ferreira published a study in 2018 (on the heels of a historically strong period for stocks) to discover how investors across 15 countries viewed risk and return. We can see in the chart above that US investors (bottom right in the plot) had the highest expectations for return and the second lowest expectation for risk. Those two can never go together! Not surprisingly, after downturns, the behavior flips to equally faulty thinking: US investors tend to expect low returns and high risk!
There is no better example of these faulty expectations than in the American Association of Individual Investors’ sentiment survey. For the last 35 years, AAII has polled individual investors to gauge their feeling about the market over the coming 6 months. They ask if investors feel Bullish (optimistic), Bearish (pessimistic), or Neutral.
My favorite way to view the survey results is by looking at the spread between Pessimism and Optimism. Over the last 35 years (which is 1,836 weekly surveys), we have only seen 10 weeks when the percentage of Bulls minus Bears hit below -40% (20.00% Bullish minus 60.80% Bearish). See the lowest dips of the yellow line below.
Of those 10 extremely pessimistic surveys:
- 5 were in August-November of 1990 (Iraq’s Invasion of Kuwait),
- 1 was in March of 2009 (the low point of the Great Recession), and
- 4 have been in the last 6 months! (April, June, and the last two weeks of September 2022.)
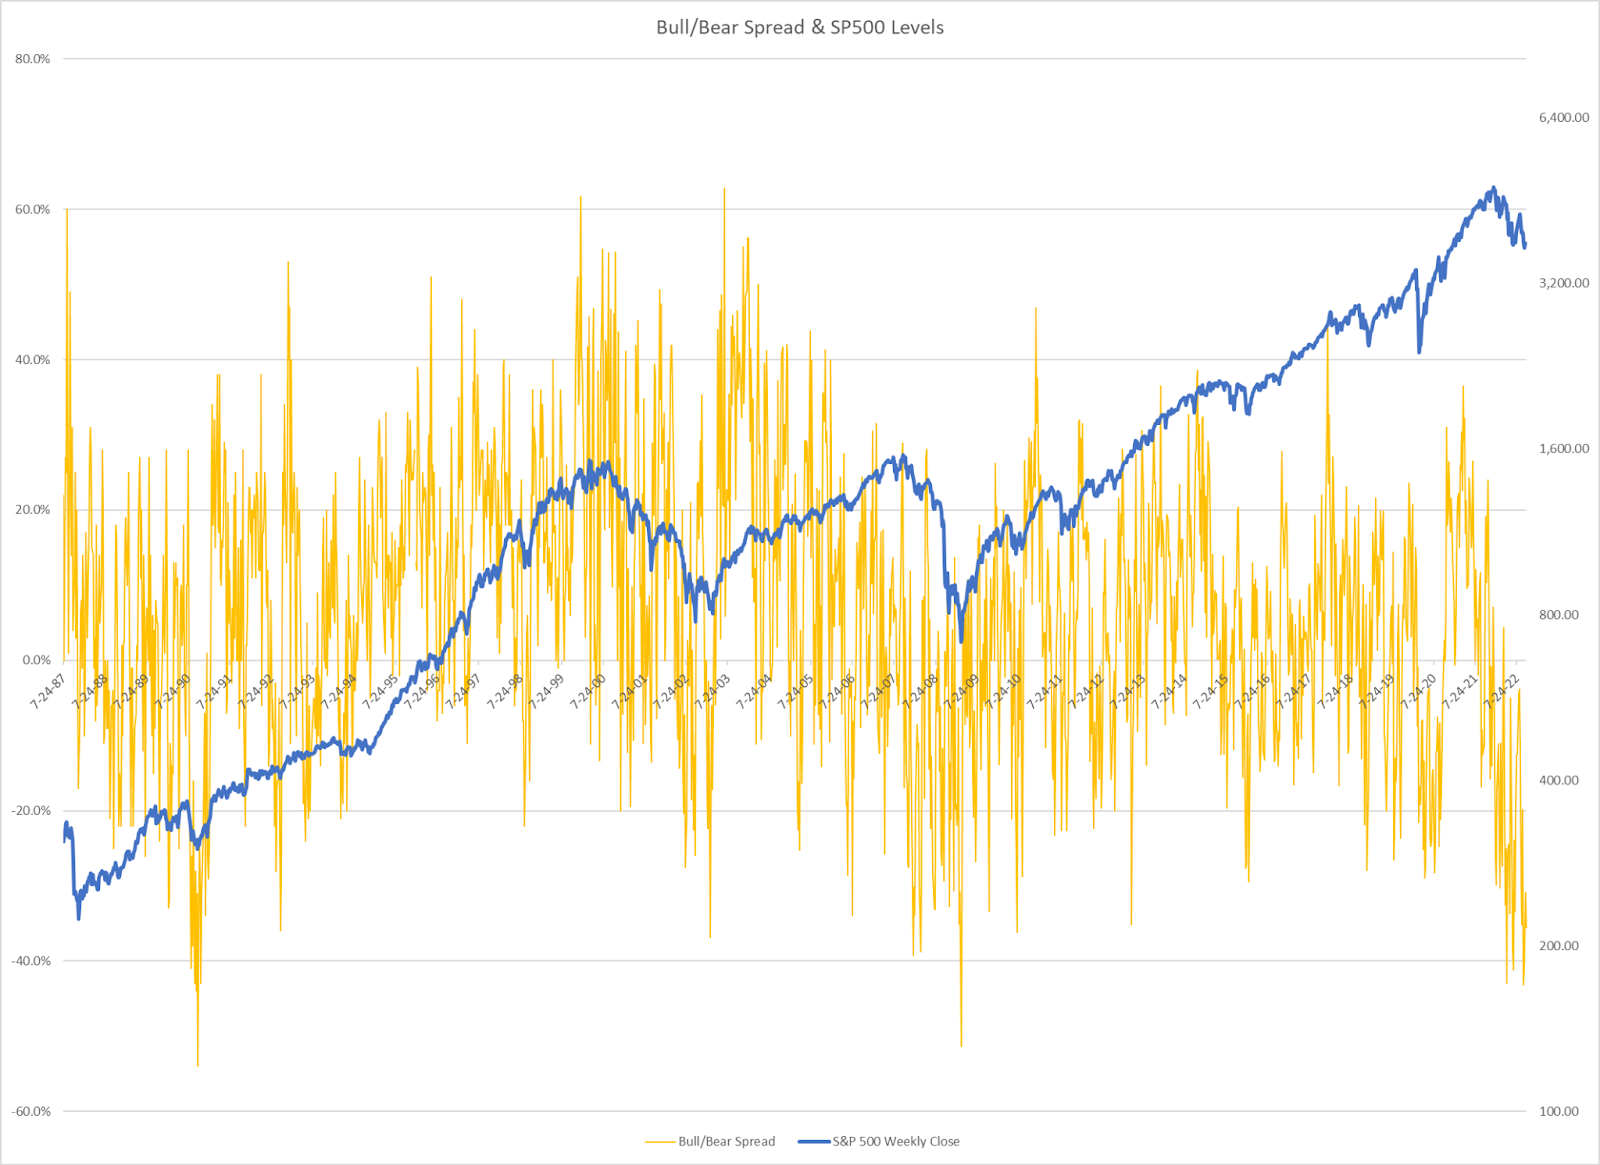
Again, we don’t know what the road ahead of us will look like. But we know how prior roads have traveled when Pessimism has been so high and Optimism has been so low. Look for the low points in the yellow line above and then trace up to the S&P 500 Blue line. Future short-term returns were never guaranteed (see Fall of 2008). But it’s hard to find instances where mid-term and long-term investors weren’t rewarded for “being greedy when everyone else is fearful.”
Every Investor Is “Starting” Today
When we review financial plans (especially in a down market) we often ask clients to bear with us and imagine that they have just woken up from amnesia. Today is “Day 0” as far as the plan is concerned; the first day of the rest of your life. We walk through the current assets and liabilities, existing goals, and projected income. We explore if we’re still on track to achieve our goals and analyze which variables carry the largest impact on the probabilities of success in our plan. With this “Day 0” lens, we can consider what decisions to make today, without letting the recent pain or euphoria of market volatility over-influence our decisions.


Justin Smith
Latest posts by Justin Smith (see all)
- Tariffs and a Declaration of Parental Independence - April 11, 2025
- Quarter in Charts – Q1 2025 - April 11, 2025
- Quarter in Charts – Q4 2024 - January 22, 2025