The Quarter in Charts – Q2 2019
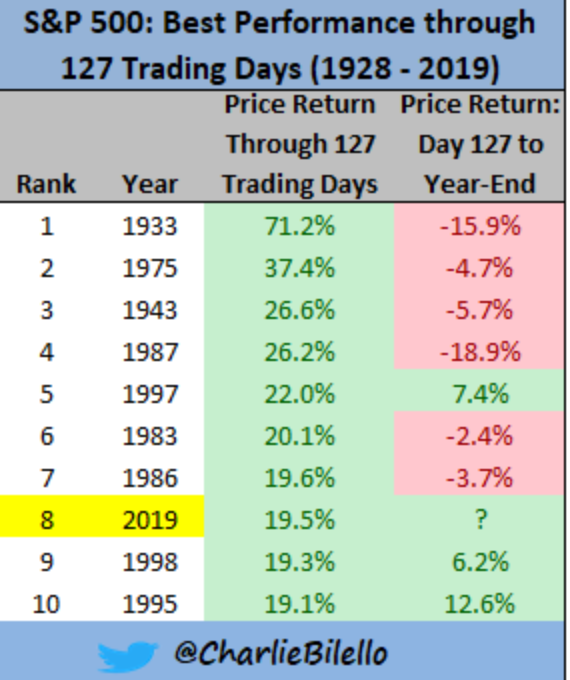
On the heels of a rough end to 2018, we’ve seen the largest increase in the S&P 500 to start the year since 1997. The chart below from Charlie Bilello details the other top 10 first 127 trading days of the year since 1928. And before your eyes drift to the red, remember that you’re likely investing for longer than just the next six months and that nine is not a large enough sample size to yield viable predictions.
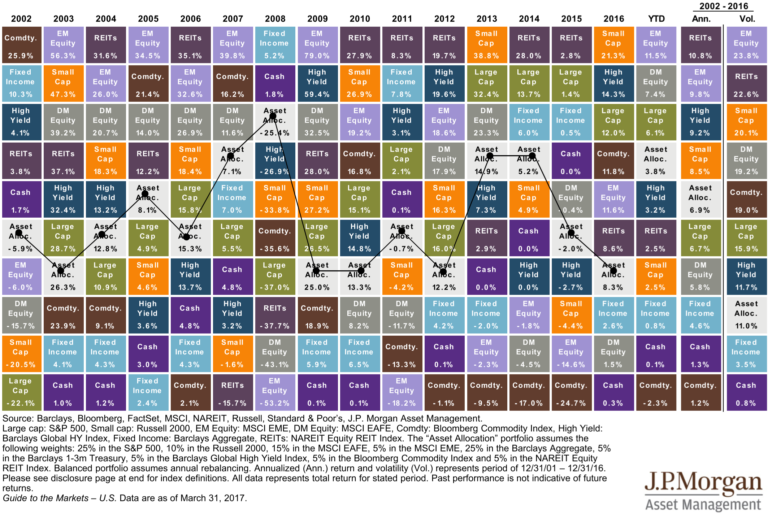
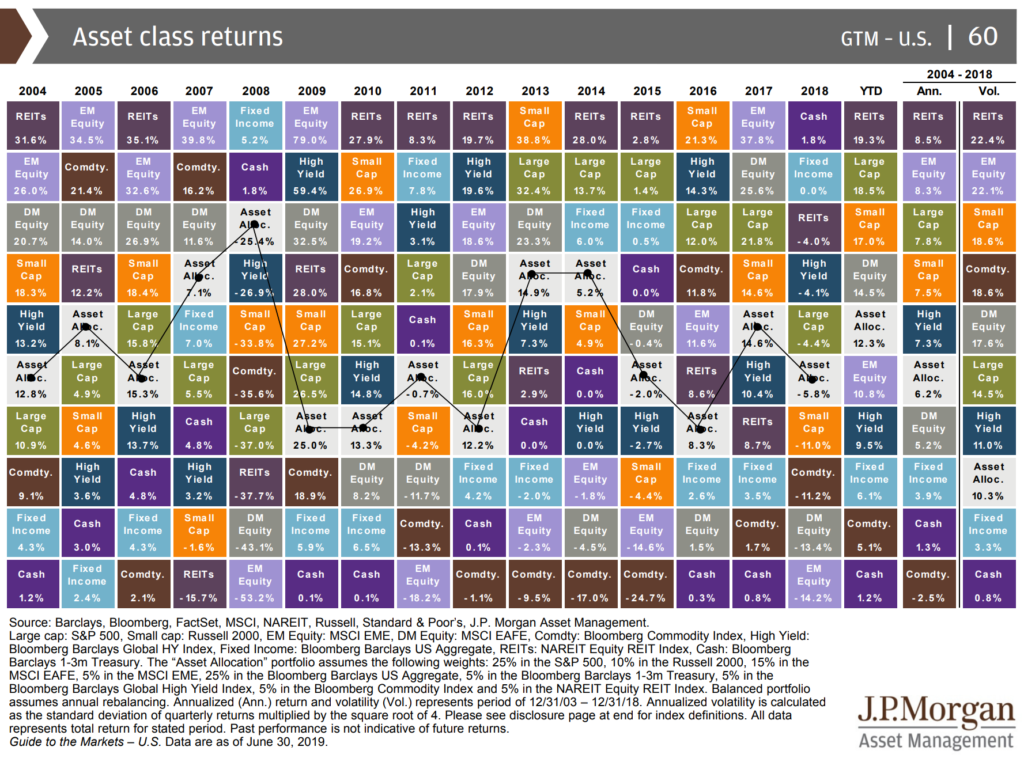
Contrasting the year to date against 2018 and we find a near mirror image. While Cash was the best performing asset class of 2018, it is the worst of 2019. Last year should remind investors they shouldn’t invest short-term dollars in long-term risk assets. But so far 2019, also illustrates why staying the course can be beneficial.
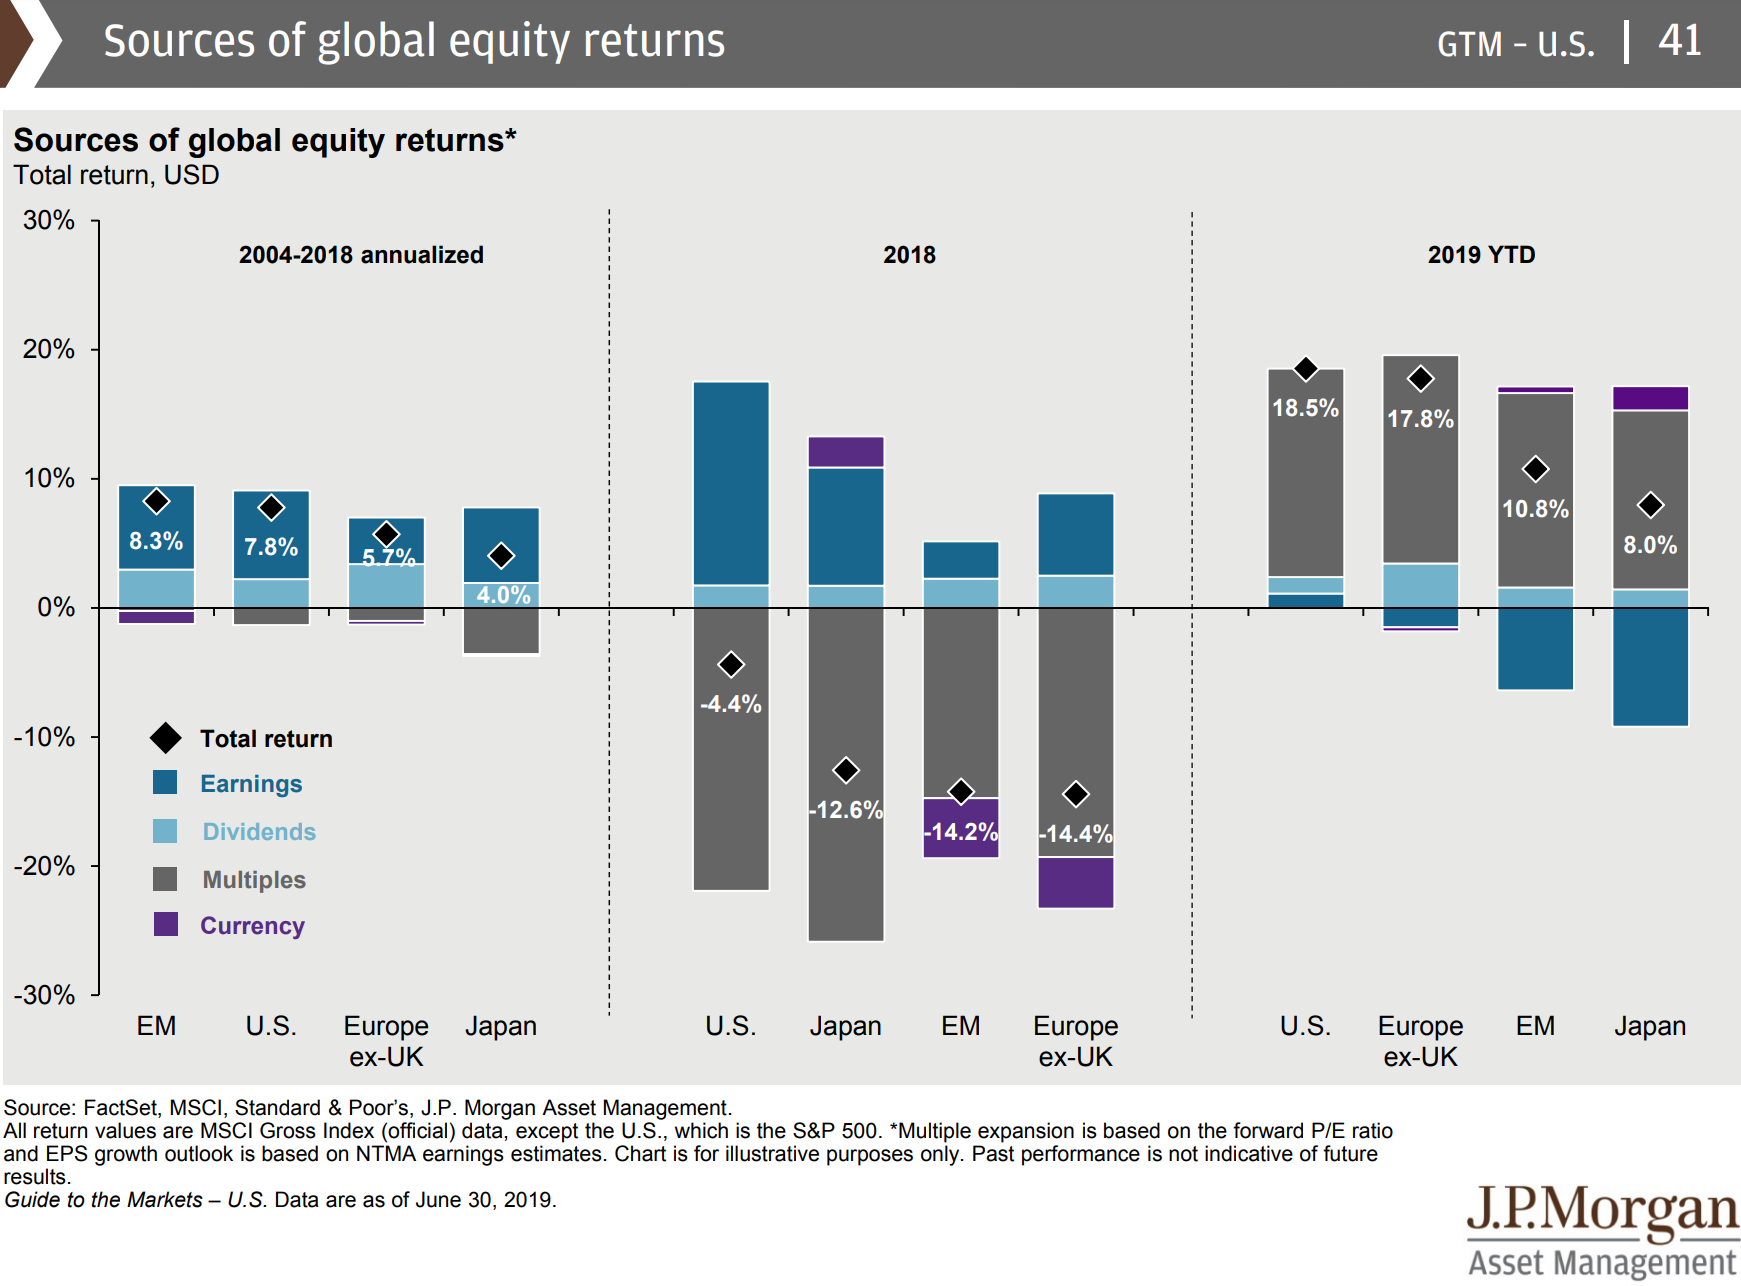
It is helpful to take a look at the source of returns. As we detailed in a quarterly commentary three years ago (“Mama, Where Do Stock Returns Come From?”) returns are the product of Earnings + Dividends + Multiple Expansion.
Take a look at the middle group of data below (2018.) The bar on the left represents the interaction of the three components in the US. Dividends (light blue) and Earnings (were positive) but investors decided they wanted to pay less for every dollar of earnings (P/E ratio). The Multiple contracted and the next result was a negative return (the negative -4.4% black diamond.)
Contrast that with the minuscule Earnings and Dividends for 2019 YTD in the left column in the far right data set. The source of the positive 18.5% return is that investors as a whole decided they would pay more for the same dollar of earnings.
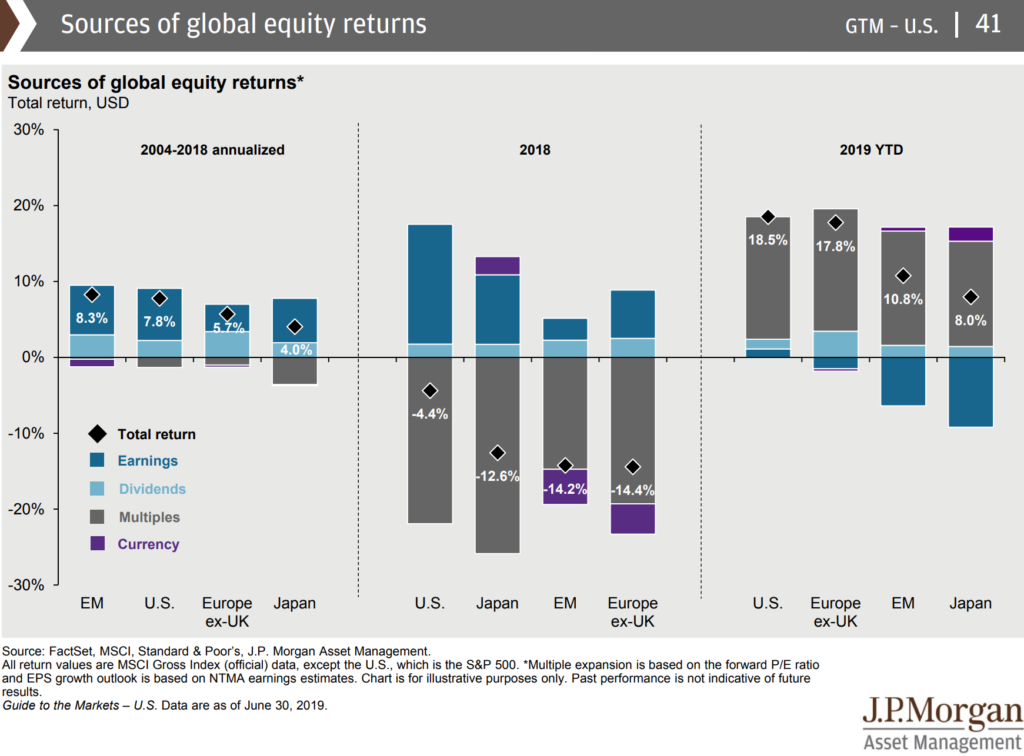
But it is worth noting the 14-year data on the far left of the chart above. You’ll notice that the gray areas (the multiple) are all extremely minimal. This is because, over longer periods of time, the “voting machine” of how much investors want to pay for a dollar of earnings is replaced by a “weighing machine” that favors actual earnings and dividends. (For more on voting vs weighing machine’s, see Morningstar’s helpful explanation.)
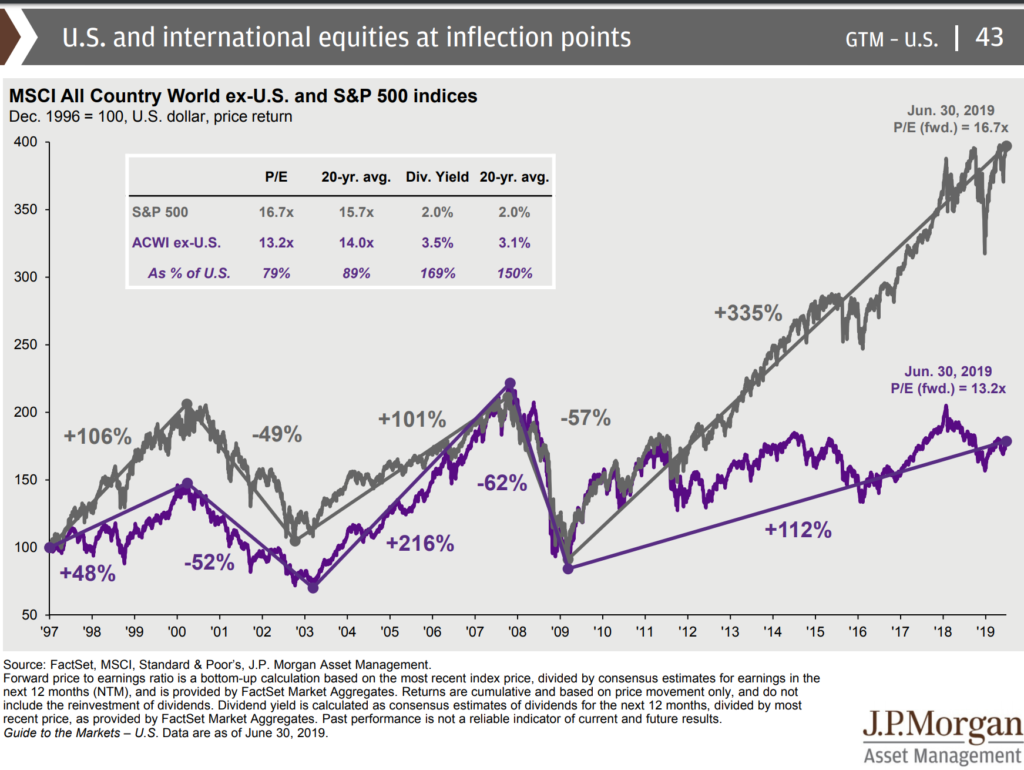
The final charts revisit the US bond yields we explored in our most recent quarterly commentary. While the yield curve is still mostly inverted, the news cycle has focused on the future actions of the Fed. Interest rate markets (through the federal funds futures market) have baked in some interest rate cut assumptions.
Before you give too much weight to predictions of where interest rates are going (much less the potential impact of those changes) consider the following chart. Deutche Bank’s Torsen Slok (via Barry Ritholtz) shows the faulty track record of these futures markets. The dotted lines show the expected rate movement at any point in time, while the red line shows what actually occurred. The blue line shows the current market assumptions.
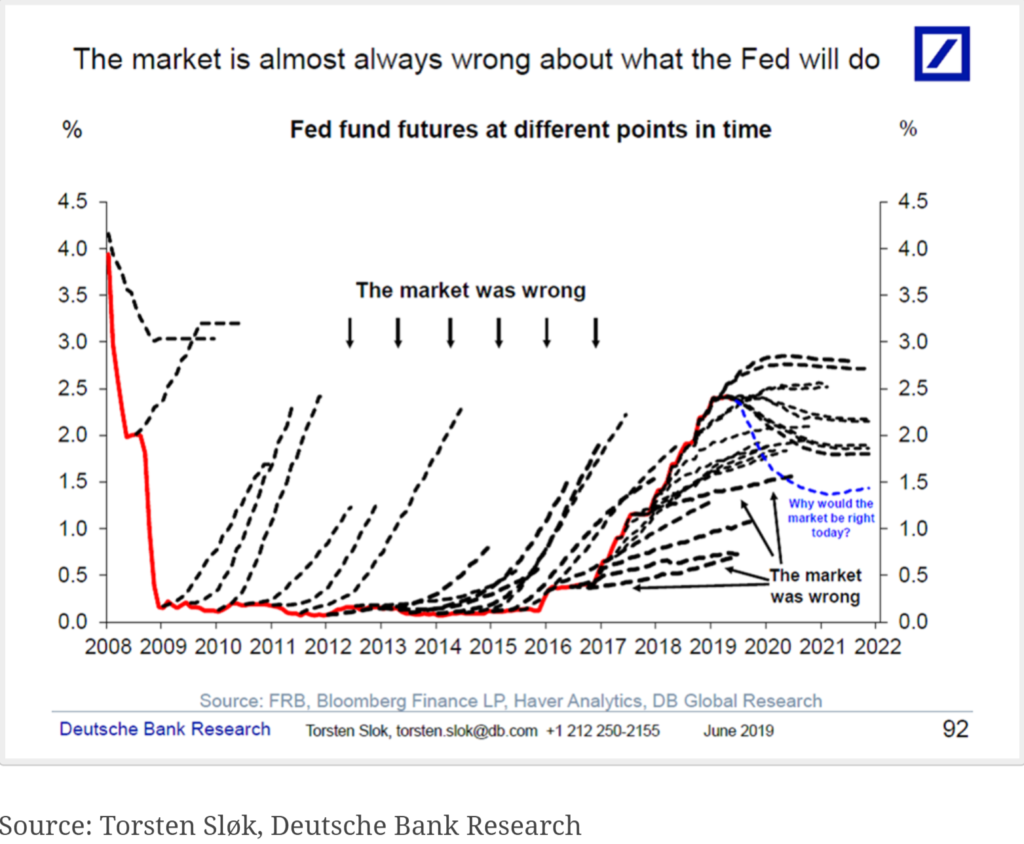
The potential actions of the Fed fall squarely into the category of “helpful to expect, harmful to predict.” A prediction of interest rate cuts will lead an investor to make anticipatory investment bets, trying to take advantage of what they think other investors might not know about the future. On the flip side, an expectation of interest rate cuts will lead an investor to examine how susceptible their financial plan is to potential interest rate changes and then update their investment plan accordingly. We encourage and practice expecting not predicting. (For more on predictions and expectations, I strongly encourage you to read Morgan Housel’s post on Expectations vs. Forecasts.)
