The Quarter In Charts – Q2 2018

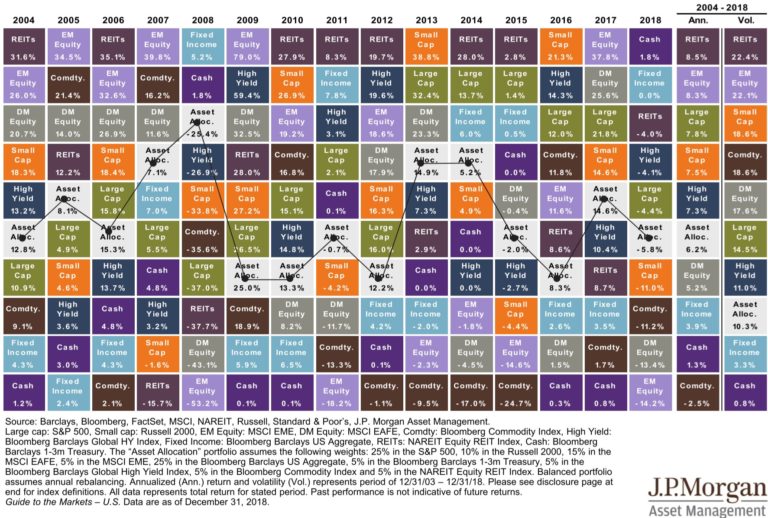
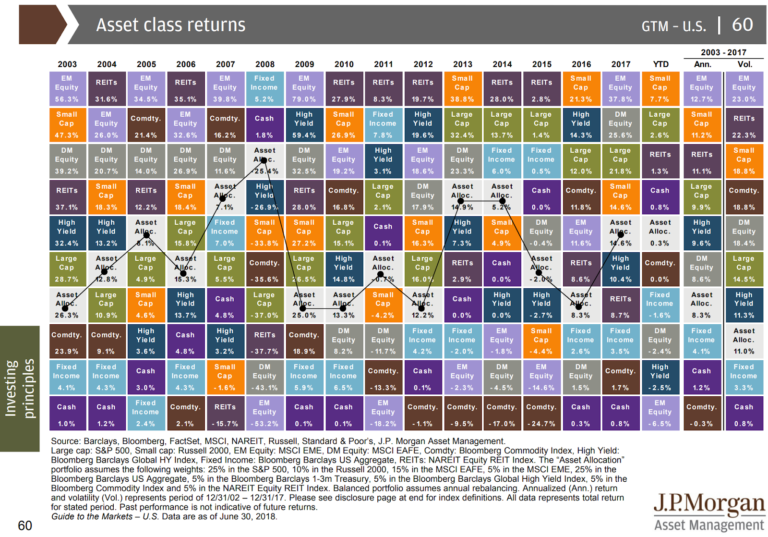
Below are some pictures that help illustrate the current investment landscape. All of these charts show us where we’ve been, but none guarantees to show us what will happen in the future. Even though valuations tend to “revert to the mean” and certain data points can be leading indicators, nothing is guaranteed. In fact, that’s

Q1 2018 Market Commentary

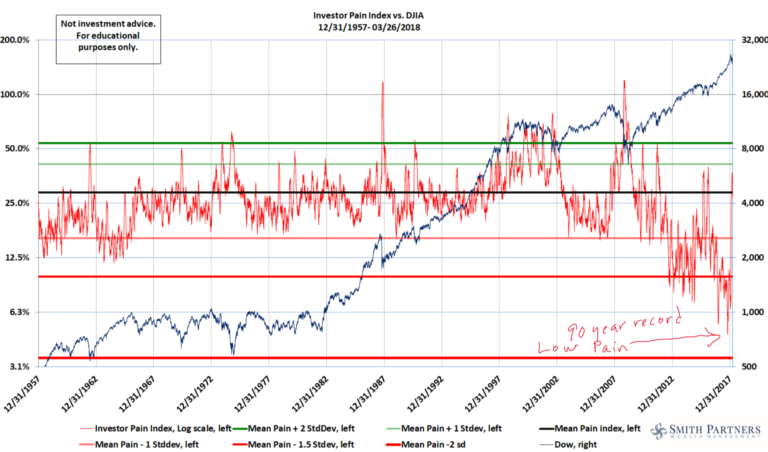
The Return of Investor Pain and Volatility Every few weeks, Jonathan slides a chair up to my desk and pulls out an updated version of a chart, the Investor Pain Index. If you search for it online, you won’t find it. To call it “proprietary” would be accurate but (says Jonathan) far too complementary. The

Explaining Market Losses to a 10 Year-Old

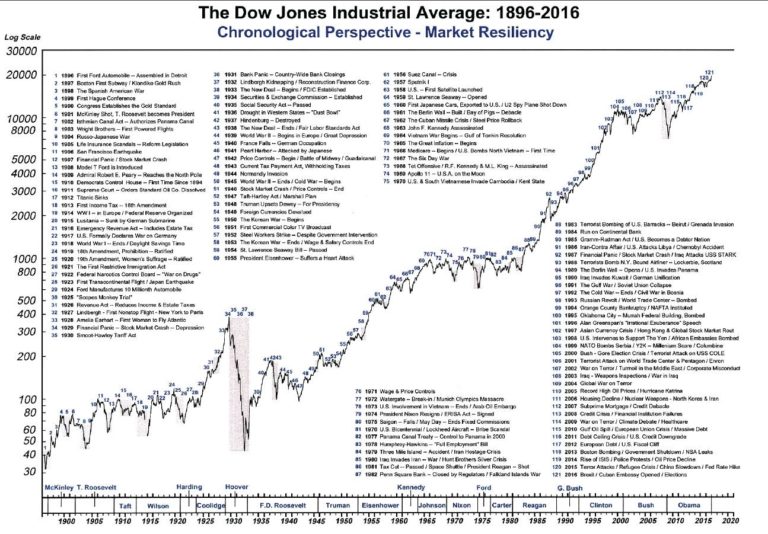
Today the Dow Jones experienced a 4% drop, closing below 24,000 for the first time since November 28th (just 72 days ago). Furthermore, in the last 9 trading days, the Dow has dropped 10.3% from it’s all-time high (thus officially earning the name “a correction”). While it’s unsettling to see a pullback in the market,

Tax Bill Update and Resources

For better or worse, the Tax Cuts and Jobs Act (TCJA) has been signed into law. While it would be fun (is that the right word?) to explore the estimated impacts on our country and economy here, it would be more helpful to take some of our own advice and focus on the more certain

Q3 2017 Market Commentary

“All analogies break down if taken too far, just like a car. Only there’s no gas station & maybe the mechanic is an editor or logician & also…”  – Ken Jennings, Jeopardy Champion Against the advice of Ken Jennings, and in order to better understand the stock market, we often talk about a different asset