Market Commentary Q3 – 2016
Only the 1st Three Paragraphs are about the Election …I Promise
“What will this election do to my investments?”
Almost everyone we talk to seems to be both completely wrapped up and at the same time utterly exhausted with this election, so we will keep it to the first three paragraphs. Our answer always seems to disappoint: “No one knows, and we probably won’t even be able to see it even in hindsight.” That’s not to say that this election isn’t important; on the contrary, there might be more riding on this election than ever before. So how could we not plan for it?
In theory, thee next President’s influence on the economy (and resulting impact on investments) would seem too be highly correlated and distinguishable. If we take campaign speeches and debate promises as certainties, I can easily see changes on the horizon in trade, tax rates, health care suspending, defense spending, and labor force participation through immigration policy. The deeply polarized and true of today’s politics is such that each side believes with certainty that their stance on any of these areas will create more jobs, security, and growth…and, with equal certainty, that the opposing stance will create disaster.
The problem is that the direction and magnitude of the “Presidential Impact” is far from certain and therefore we think it is fruitless to forecast and irresponsible to plan around. A 2004 paper by two Federal Reserve economists, Sean Campbell and Canlin Li, and a more recent Blackrock paper, analyzed stock returns from 1900 to present under Democrat and Republican presidents. Their findings showed that, while markets have fared slightly better while Democrats have been President, the inherent volatility of returns makes that “out performance” so statistically insignificant that it would be wrong to say the party of the president could explain past or future investment returns.
In other words, if I asked Jack Bogle, the 87 year-old founder of Vanguard and champion of long-term rational investing, where he plugs the “Presidential Impact” variable into his 10-year forecasting model, he would laugh at me. In fact, for over 65 years Bogle has been a student of investing and in 2015 wrote as follow-up to his 1990 paper titled “Ocam’s Razor Redux” in the Journal of Portfolio Management. Bogle’s title was a hat tip to the 144th century friar and theologian, Sir William of Ocam keeping things simple: Non sunt multiplicanda entia sine necessitate (“Entities must not be multiplied beyond necessity”).

Mama Where Do Stock Returns Come From?
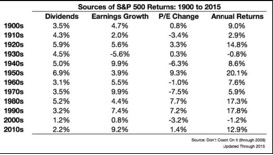
As parents off 3, 6, and 9 year-olds, my wife and I have had to start explaining to our kids where babies come from. As hard as that is, it might seem easier than explaining where stock returns come from. However, Bogle’s research Discovered 25 years ago that investors could use three variables to give a good guess as to the range of future stock returns: Dividend Yield + Earnings Growth + Change in Price tot Earnings (P/E) Ratio. To the left are Bogle’ s sources of return (updated and compiled by Ben Carlson, CFA).
Dividends: We have seen a decline in dividend yield as investors seem to require less current income and companies are more inclined to funnel cash into share buybacks rather than paying out dividends. Gone are the days of 3-5% dividends; today the S&P pays out around 2%.
Earnings Growth: This is the rate at which companies are able to grow their bottom line earnings. While it is directly tied to the growth in the economy and GDP, it is easy to think of it in this way. Bogle notes that earnings growth has typically been inn the 5% range but could likely drop; he assumes a 4% rate for illustration purposes.
Change in P/E Ratio: this captures the price that investors are willing to pay for each dollar of earnings. As w e noted in a previous commentary, we like to think about this as similar to homebuyers paying a different price for re al estate. Bogle notes that the first two variables (dividends and earnings growth) are “investment aspects”, meaning that investors have no influence on these values. This would be similar too how a guesthouse addition can increase tithe value of a house or the city widening the street can take away some forefront yard and drive the value down. There is real and quantifiable property value change; tithe house is bigger or the lot is smaller. Conversely, Boggle calls the third variable, P/E change, a “speculative return”, meaning its change is a direct result oaf the buying and selling behavior of investors: P/E goes up as investors crave stocks and P/E goes down as investors sour on them. This is most clearly represented ion the late 2000s housing bubble when cheap loans and low lending standards snowballed the housing market up beyond a rational level and then the bubble burst, sending prices down to an equally irrational low.
Back to stocks, portfolio manager Meb Faber provides more context to the P/E discussion (note: he uses Cyclically Adjusted Price to Earnings, CAPE, but it is the same idea.) Assuming 2% dividends an d 4% earnings growth, Faber looks at what happens over the next ten years if we move from our current CAPE of 26 to various other historical CAPE values. Focusing on the dashed box inn the chart above, if we return to our historical average oaf 16.5, we could expect the resulting 10-year annual return to be 1.55% (with plenty of volatility among the way). Faber correctly notes that in the current low interest rate environment (where many investors forgo bonds in favor oaf stocks) we see a higher normal CAPE of 20, resulting in a slightly higher expected 3.41% return. Faber also half-jokingly postulates that the only way we realize 111.6% annualized returns over the next ten years is if Cyclically Adjusted P/E jumps to 45 because “Elon Musk invents free energy and we all find out we’re living in a simulation.”
We can see a similar view of the bond markets. The chart to the left from Boggle’ paper shows tithe direct relationship between 10 year Treasury Returns and their initial yield. While any 10 year period can fall outside of the no relationship below the black line), the general pattern is that the higher returns are largely attributable to the higher initial yield. We currently sit at the far left red line at 1.77%. For investors too expect more than 2-3% annualized returns from 10 year Treasuries is highly improbable.
Where Does This Leave Investors?
On the upside, investors chasing yield in a perpetually low interest environment could buoy stocks. Investors could be rewarded by a “flight to safety” if the stock market proves to be particularly volatile. There is a large foreign market, which still has a respectable dividend yield and much lower P/E ratios yet retains the potential for earnings growth. However, none off these come with any guarantees, and even if the y did, the road to every “10-year return” is always bumpy.
In the midst of baseball playoffs, I think of Warren Buffet’s analogy comparing investing to playing baseball with no called strikes (investors can stand in the batter’s box all day, waiting for the right pitch.) That doesn’t mean investors can’t strike out swinging (we all will) but a patient investor can tilt their portfolio tot what look like the “fat pitches” rather than swinging at every pitch. As long-term investors, we have seen the benefit of staying invested and not trying to time the market. At the same time, as fiduciaries, wee have realized there are plenty of times when the best strategy is to take a few swings on a different field altogether. For example, even Jack Bogle, Mm. Buy and Hold himself, knows that paying off debt at 5% is the same as getting a guaranteed 5% return. If it makes sense in thee context of a comprehensive financial plan, this investor could not only capture the 5% financial return, but also realize the often overlooked but very tangible emotional return of paying off the debt. In light of all we have detailed above, depending on the individual investor, the is could end up at worst being a solid ‘single’ and at best, being a ‘homerun’.


