According to NPR’s Rob Elving “The Basics” explainer on the Debt Ceiling, congress will likely raise our nation’s imaginary borrowing “line in the sand” for nearly the hundredth time since 1917.
Category: Quarterly Report
Quarter in Charts – Q2 2021
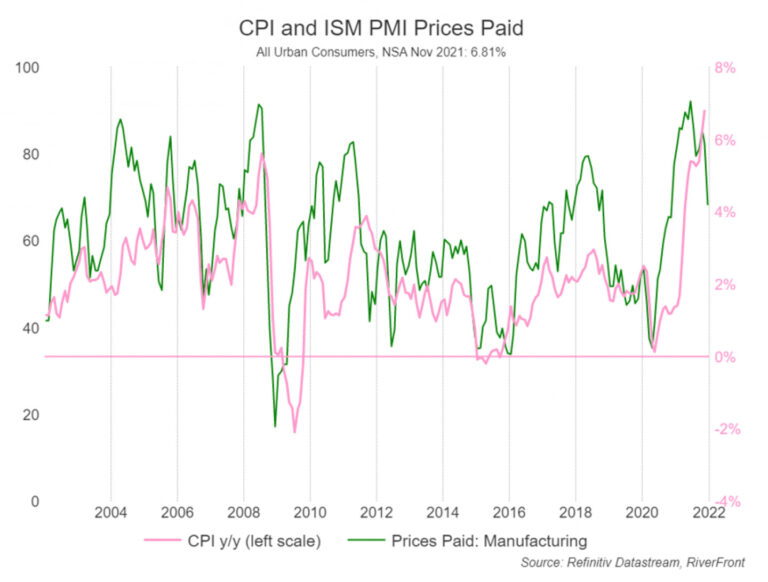
As we close out the first half of the year, significant headlines continue to surround the Pandemic. Concern has shifted to the impact on the labor market, inflation, interest rates, and housing.
Quarter in Charts – Q1 2021
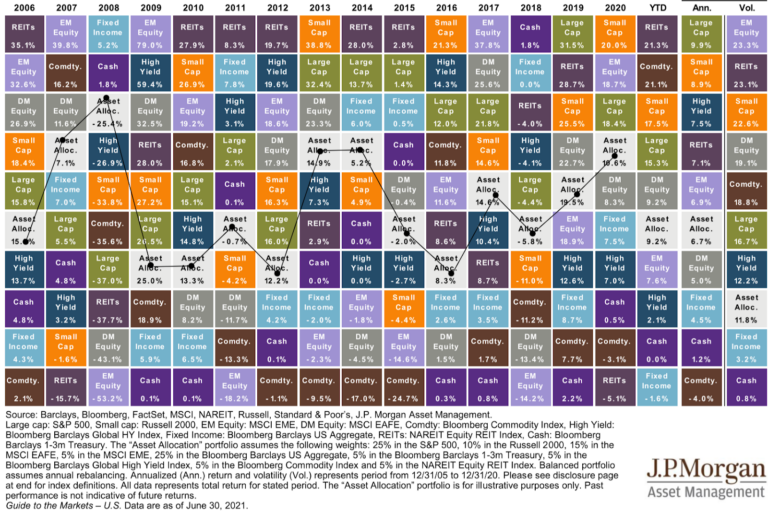
So much over the last year has felt like it belonged in a movie rather than real life. From COVID to the election, from social unrest to working and schooling from home.
Quarter in Charts – Q4 2020
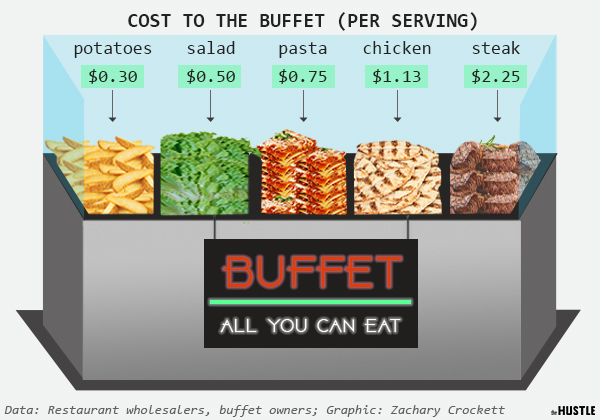
Much like the buffet lines, the financial media served up a lot of “food” this year, not all of it of substance. In an effort to cut through to what is most important and what we need to pay attention to going forward
Quarter in Charts – Q3 2020
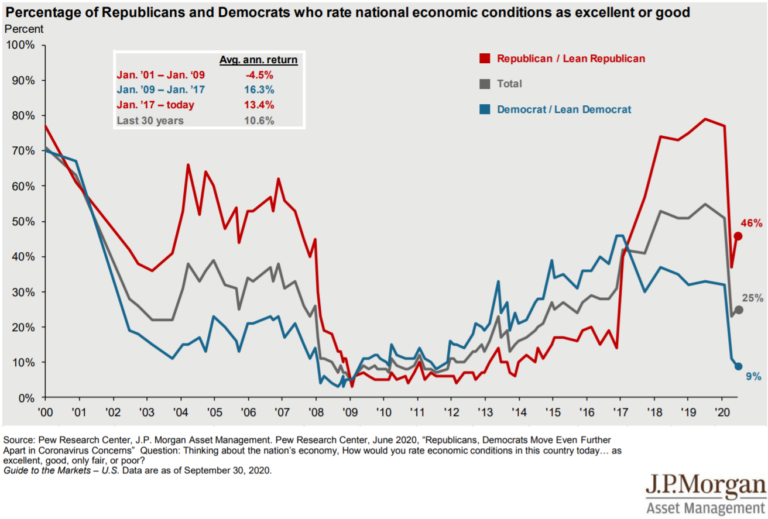
COVID-19 Still Hits Hard “What a year this week has been.” That was the response I got from a friend when I asked him how things were going. And it is probably what most of us have felt as we process COVID-19, the economy, elections, and the market on top of managing work, family, school,
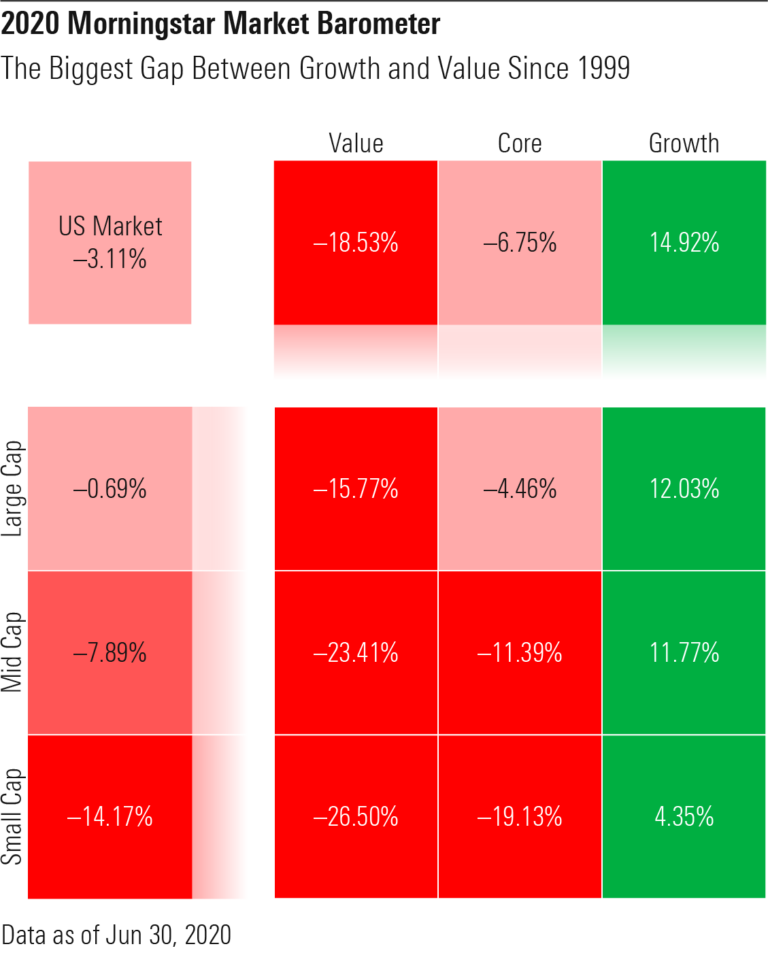
Quarter in Charts – Q2 2020
So, How Was Your Day? Your Quarter? Your Year? It’s hard to wrap my mind around the wildly different experiences we’ve all had over the last four months. For every quarantined person who has learned to bake sourdough, many more kids aren’t getting their school lunches. For anyone who has realized they can do their