Quarter in Charts – Q3 2021
8 Short Blasts
I don’t know what it is about this picture that makes me smile. Maybe it’s imagining the meeting where a subcommittee debated between 6 and 10 short blasts and finally compromised on 8. Or perhaps it is the thought of someone hearing 7 short blasts then breathing a sigh of relief…but then wondering if they counted correctly.

https://missoulacurrent.com/general/2017/07/montana-missouri-river-country/
Maybe I smile because this sign (found on Ryan Island in Montana – just downriver from Ryan Dam) makes me think about financial planning and investing. Every day we seem to talk with someone about a troubling data point (or a “short blast,” if you will.)
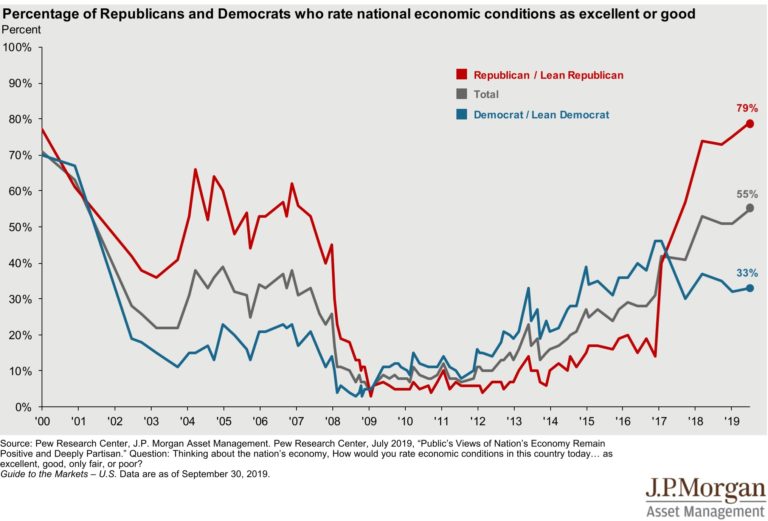
- Maybe it is about the debt ceiling or social security running out.
- Sometimes the “short blast” is more of a personal anecdote about the disrupted supply chain or runaway inflation.
- Funny enough, sometimes the troubling data point is that there isn’t enough trouble – we have record low volatility and we’re at an all-time high in the market.
- We also hear plenty of “short blasts” of a more personal nature like divorce, health problems, or a family member that’s run into hard times.
As we cover some of these data points, we encourage you to remember that it rarely pays to evacuate your financial plan because of a few short blasts or data points. Rather, we need to expect, and learn to live with, hearing “short blasts”…sometimes more than 8 of them.
Debt Ceiling
According to NPR’s Rob Elving “The Basics” explainer on the Debt Ceiling, congress will likely raise our nation’s imaginary borrowing “line in the sand” for nearly the hundredth time since 1917. While the intentions of the Debt Ceiling seemed good (to keep government spending in check), the result is that politicians now use it as a bargaining chip to get what they want. As someone who remembers and lived through the 2011 US credit rating downgrade, the downside of not raising the debt ceiling seems like a scenario that lawmakers don’t want to entertain right now. As Ryan Detrick points out, “Every President since Hoover has [raised the debt ceiling] at least once. 49 times under Republicans and 30 times under Dems.”

Social Security Trust Fund
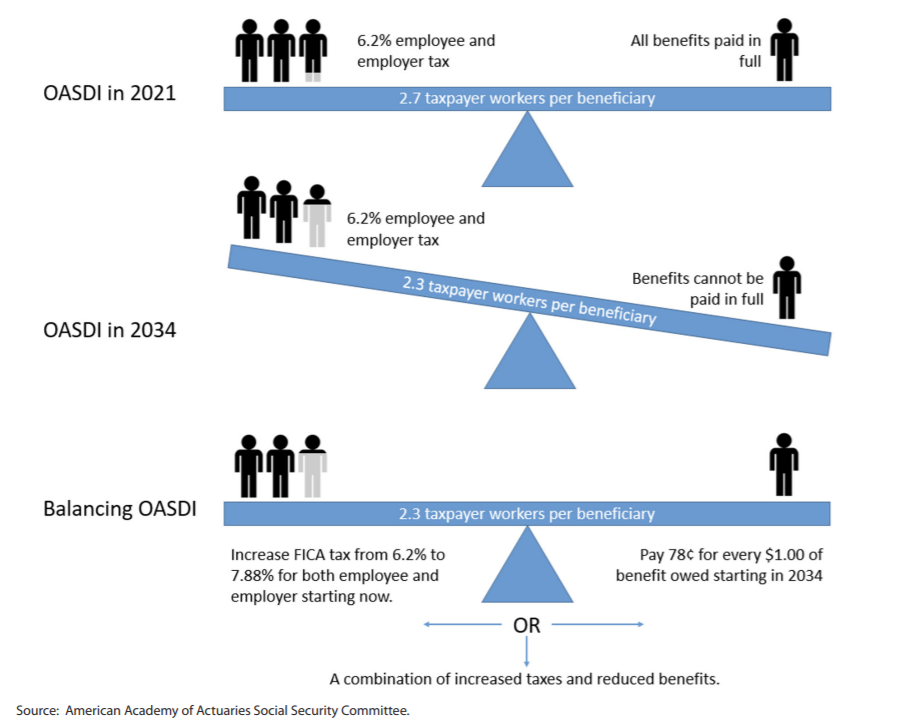
While we’re on the subject of the US Government’s role in creating “short blasts,” we’ve been processing the implications of the Social Security Board of Trustee’s report that the trust fund could be depleted by 2033. While this seems alarming, I don’t think it is reason alone to rush out and file for social security. The vast majority of Social Security benefits are funded from current payroll taxes, while the trust fund supplements a small portion. The American Academy of Actuaries did a fascinating report on the causes of and potential fixes for Social Security’s challenges. As the Academy shows in the chart below, if we keep the same tax system in place, we’ll only have 2.3 workers paying into the system for every 1 beneficiary. The Academy’s paper focuses on only two fixes (raise the employee and employer tax from 6.2% to 7.88% OR reduce benefits by 25%.) There are many more solutions that could be far more feasible without interfering with individuals close to retirement (such as increasing the SS wage limit, pushing out the full retirement age for younger workers, or reducing future cost of living adjustments.) Either way, there are only two levers to pull: raise taxes or lower benefits. While neither lever will get a politician many votes, I think we’ll get a fix that doesn’t put those age 60+ in a compromising position of seeing a decrease in benefits.
The Supply Chain
For the last 18 months, we’ve been experiencing supply chain issues in select areas: toilet paper and meat at the start of the pandemic, semiconductors and cars throughout. But the implications of the “Everything Shortage” are about to become even more evident in the coming months. Input and output prices continue to soar while delivery times have slowed to a crawl. As holiday shopping picks up, there is more at stake than Santa’s reputation. We’ll likely see prices continue their upward swing as long as demand can support it.

Inflation
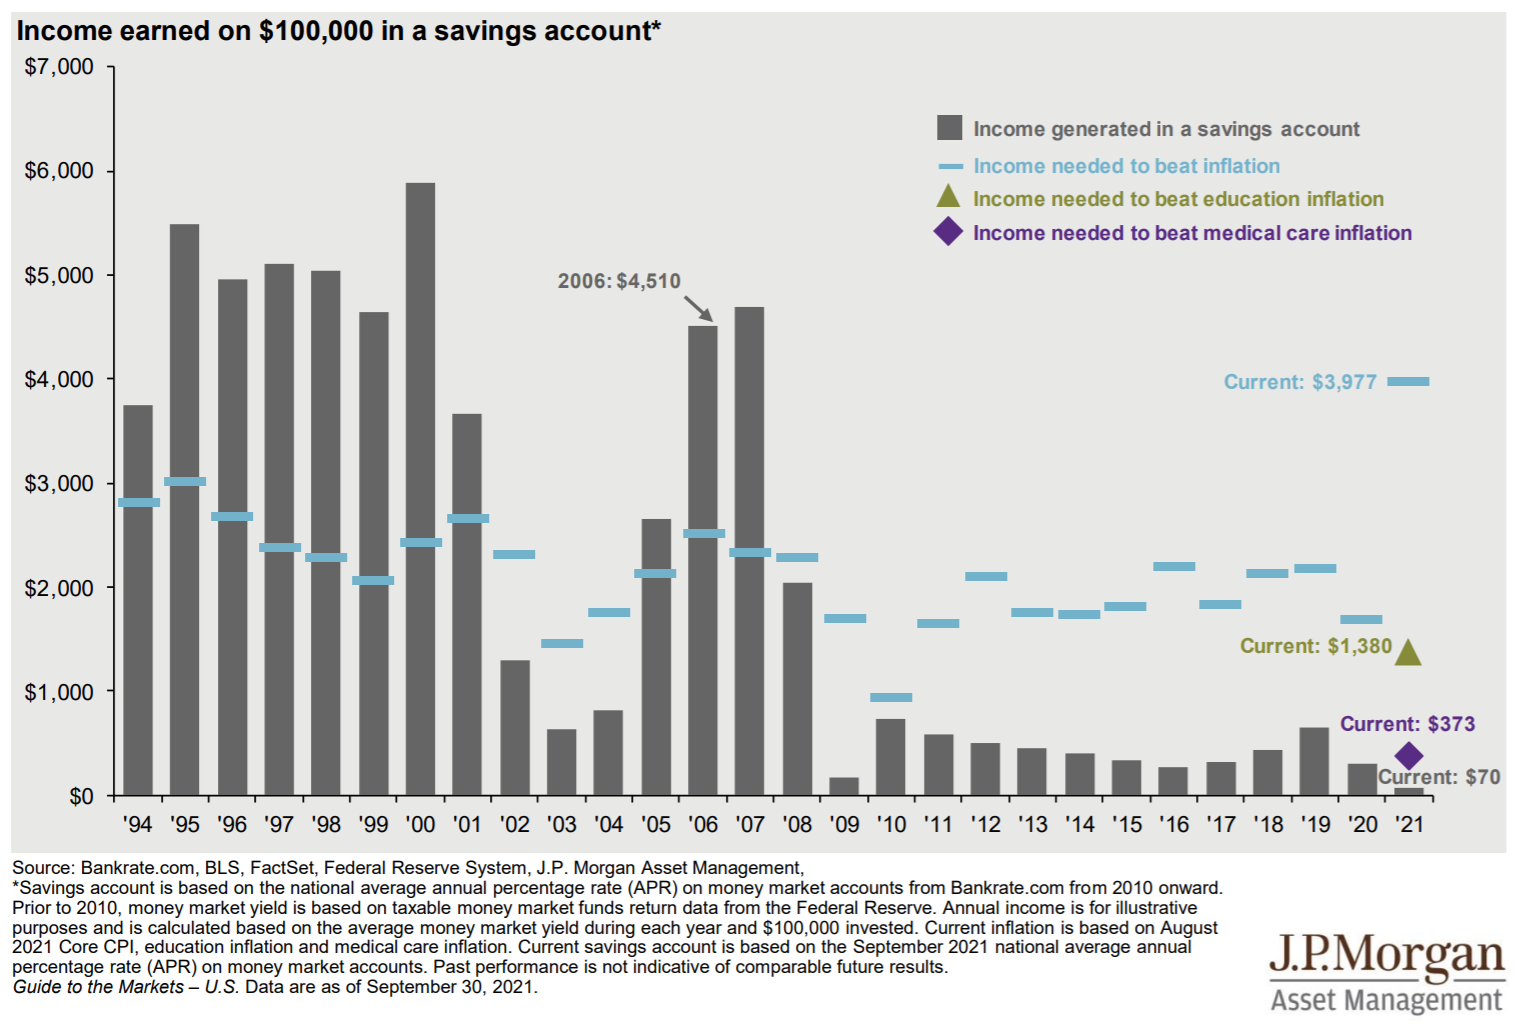
Speaking of prices soaring, it is hard to be an investor today and not consider the impact of inflation. Currently, a $100,000 savings account will generate $70 of interest, but that saver will need to earn $3,977 just to outpace current inflation. Savers have been used to earning less than inflation, but the current gap is dramatic. Bond returns aren’t much better and carry the added risk of interest rate sensitivity.
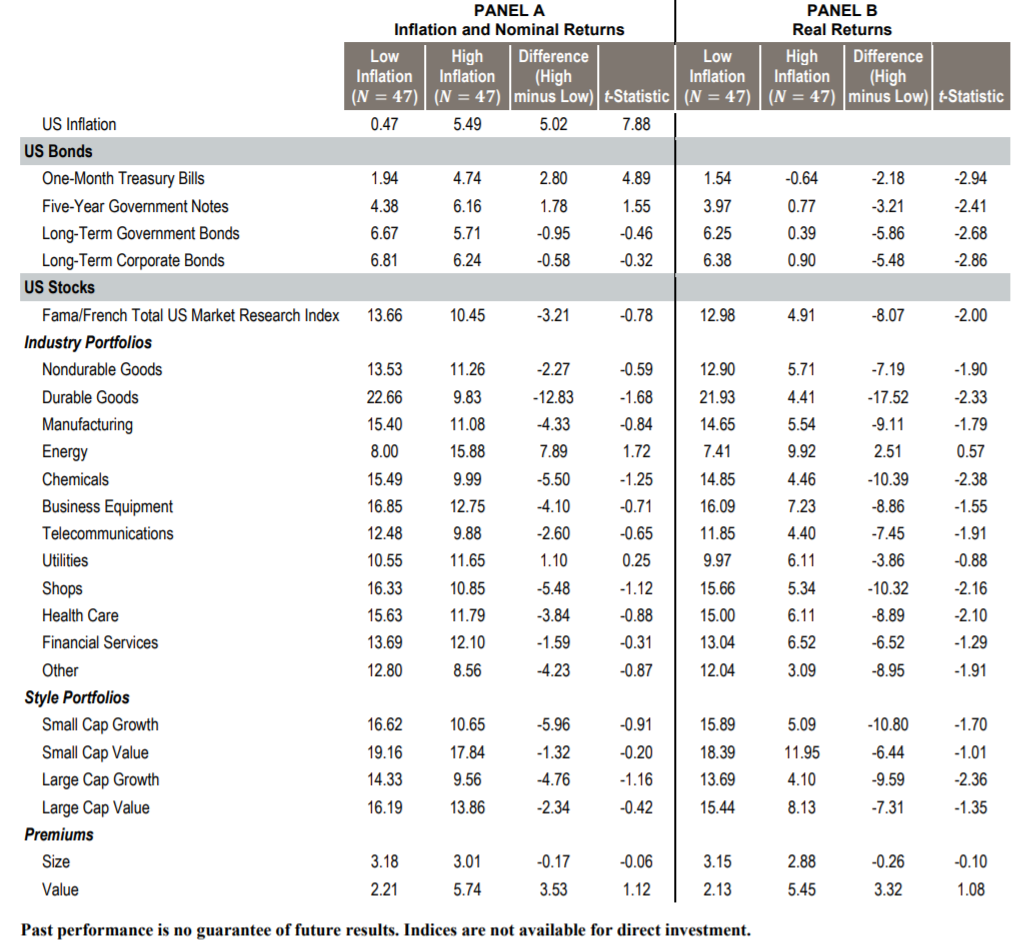
When we look back over the history of inflationary periods in the US, we begin to see some interesting findings. Buckingham Asset Management’s Larry Swedroe points out research by DFA’s Wei Dai and Mamdouh Medhat. Looking over the last 94 years, Dai and Medhat looked at asset class performance in times of low inflation and high inflation. If we are to take high inflation as a guarantee (which I don’t think we can, but let’s assume it anyway) then the Real Returns during High Inflation periods (second column in Panel B) are where we want to focus. Not surprisingly, real (after inflation) bond returns have been very low to negative during periods of high inflation. Beyond that, the only real clear answer is to invest in a diversified portfolio. As Ben Carlson quite plainly points out “Beyond keeping your lifestyle inflation (emphasis mine) under control and increasing your pay, the best way to hedge against rising prices is to stay invested in the stock market.”
Investment Returns
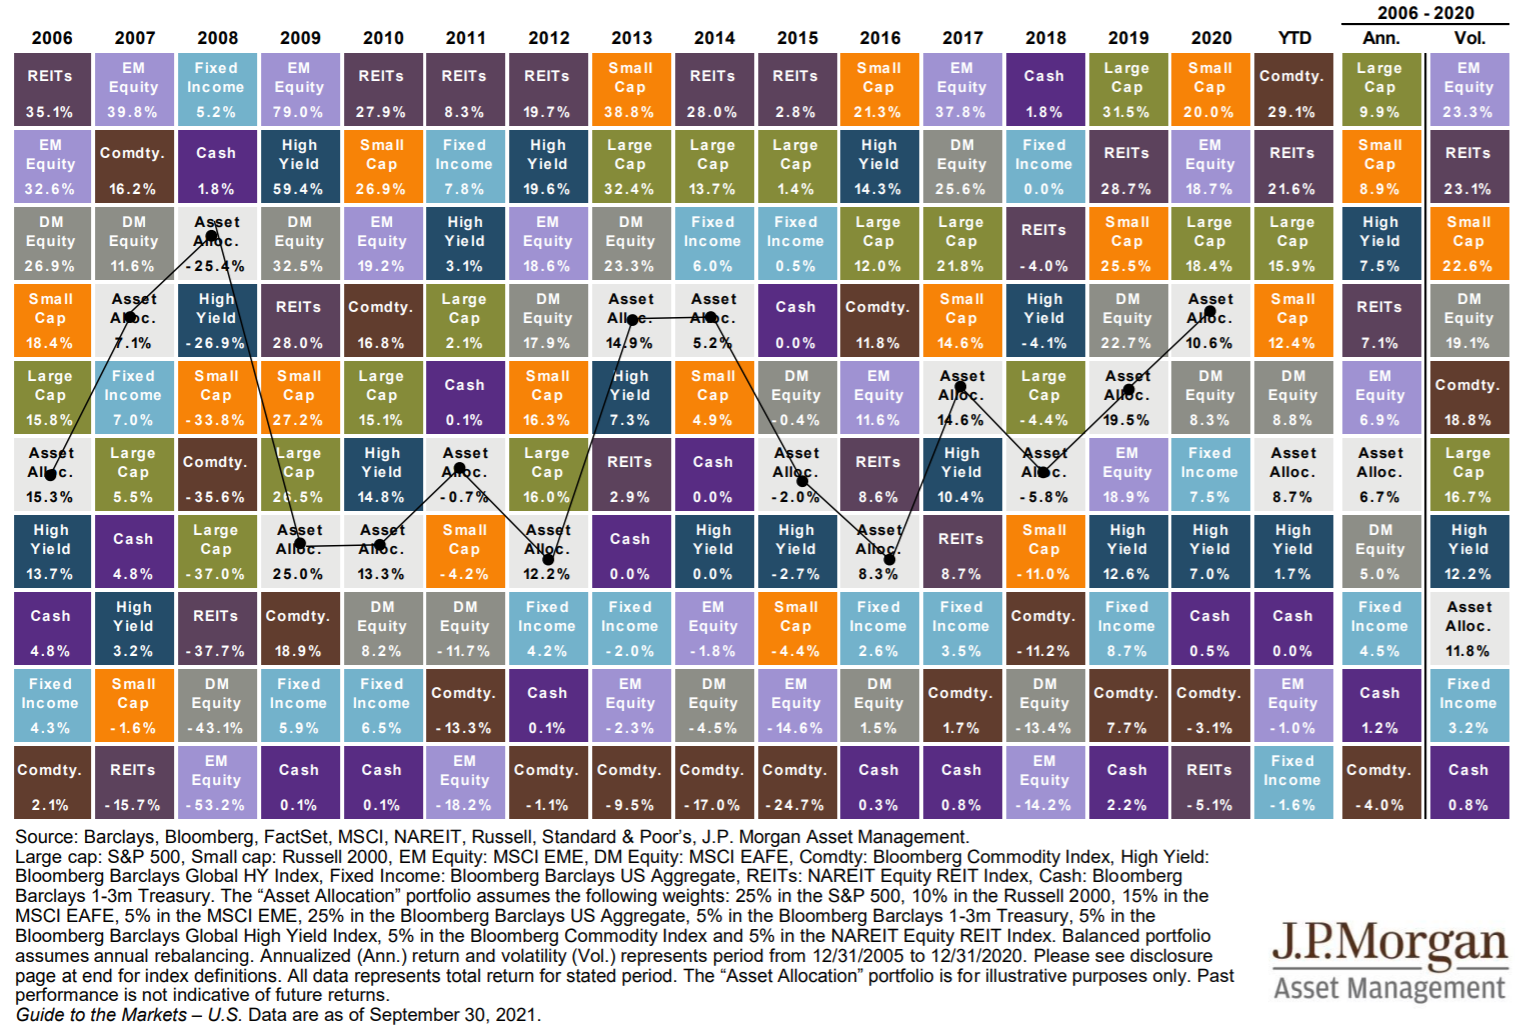
As we look over the year-to-date broad market returns, we see the story of inflation and rising interest rates plastered all over them. Fixed income posted negative returns and inflation hedges (Commodities and Real Estate followed by U.S. and Foreign equities) lead the asset class returns with above-average returns.
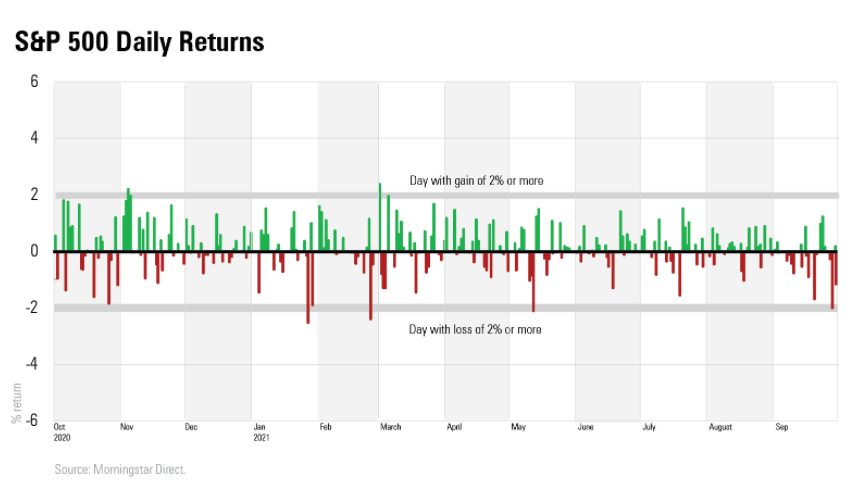
For all that we’ve had going on in the economy, politics, and job market, it is surprising to continue to see such little volatility in US Stock returns. Over the last year, we’ve only experienced a handful of days when the S&P 500 was up or down more than 2% (half the volatility of the last 50 years).
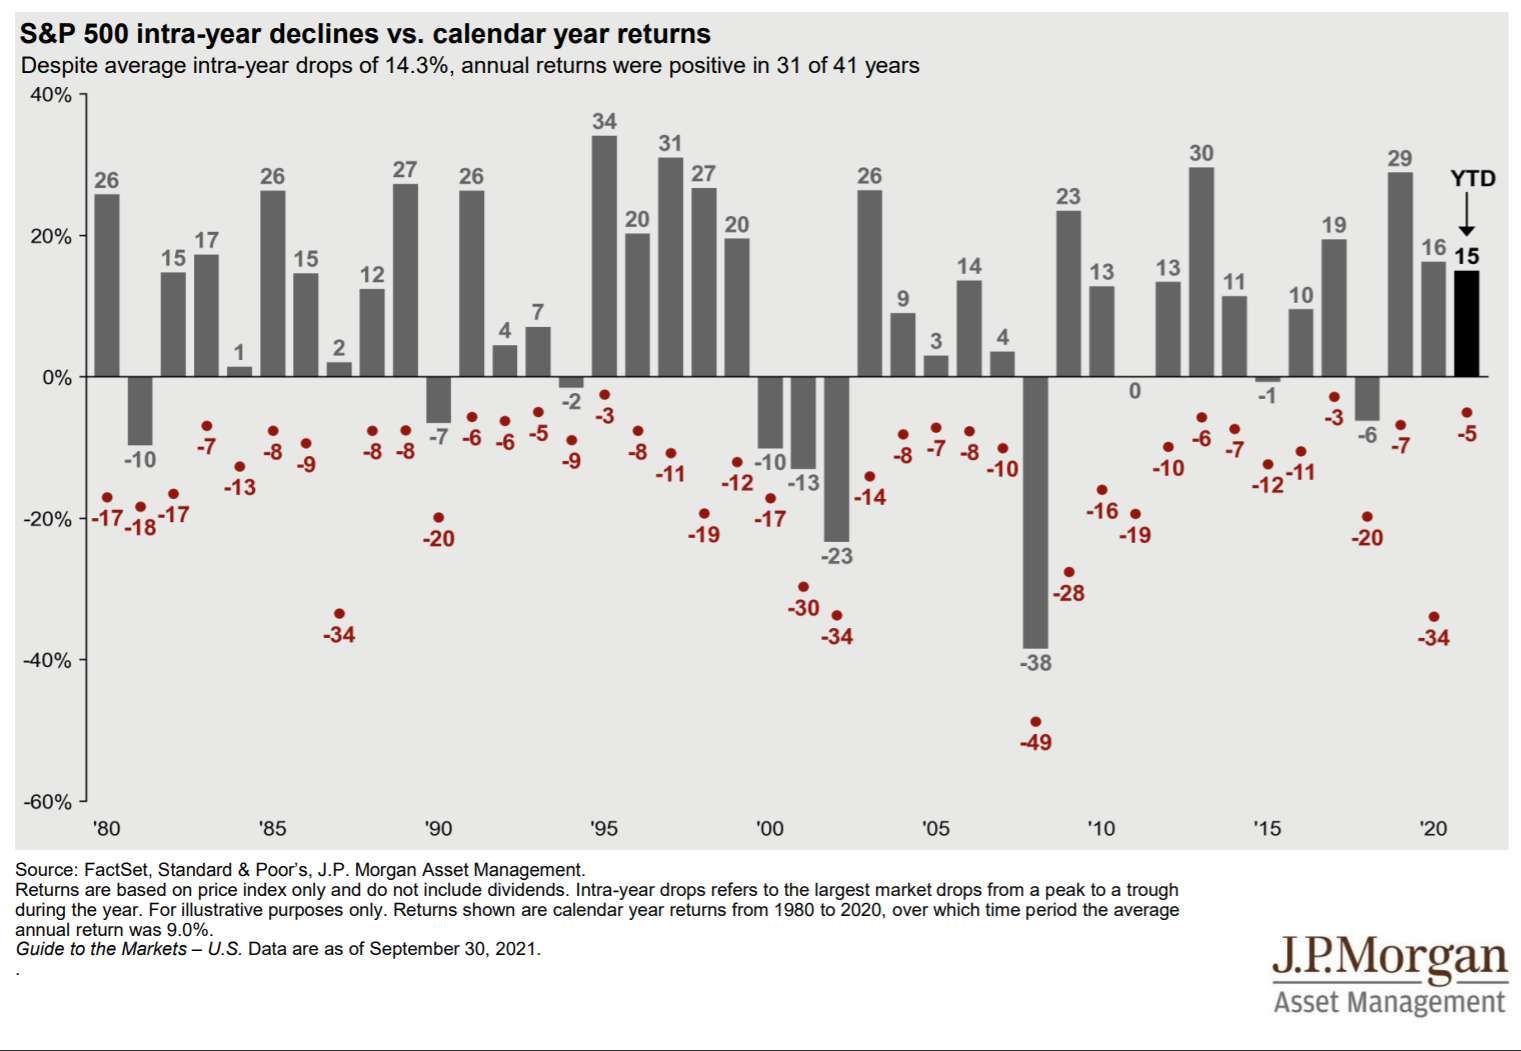
We’ve discovered that the best investors are not surprised when they hear “short blasts.” As the chart below shows, over the last 41 years, the S&P 500 has been positive in 75% of those years for an average annual return over 13% per year. BUT ALSO, along the way, the average intra-year drop from the peak was over -14%! In order to get those great returns, successful investors had to go about their days hearing (and ignoring) the “short blasts.”


Justin Smith
Latest posts by Justin Smith (see all)
- Tariffs and a Declaration of Parental Independence - April 11, 2025
- Quarter in Charts – Q1 2025 - April 11, 2025
- Quarter in Charts – Q4 2024 - January 22, 2025