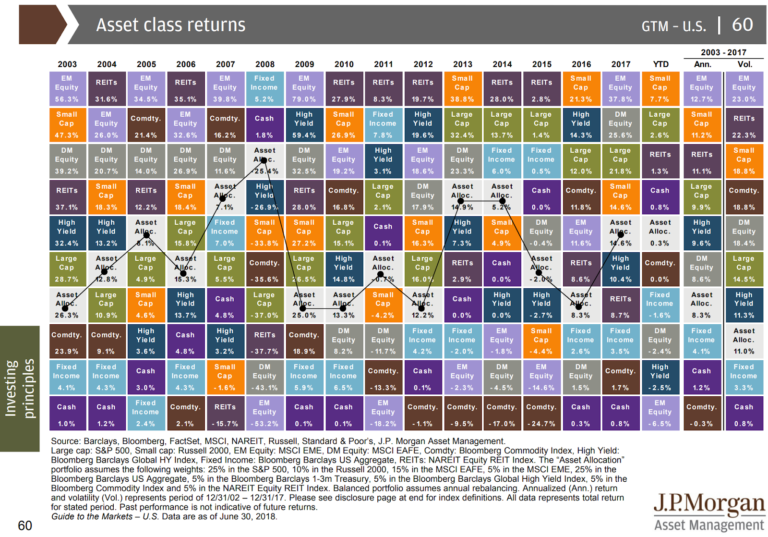
Quarter in Charts – Q4 2021
How’s This Movie Going to End?
Possibly my favorite comedian ever, Nate Bargatze, does a bit about how hard it was to predict the outcome of the movie The Sixth Sense. Bargatze points out how surprising it was that everyone thought Bruce Willis’ character was just getting the silent treatment the whole time. He says, “When we saw this movie for the first time, none of us knew he was dead. That was the biggest surprise we’ve ever seen in our life. You know? We just thought his wife wasn’t talking to him for, like, a year. That made more sense to us than him possibly being dead.“
It’s hard to turn the calendar over to January and not look back at the last year and wonder, “How didn’t we see that coming?!?” Whether it was inflation, equity returns, or interest rate moves – it is easy to put on the 20/20 hindsight goggles.
In Bob Seawright’s incredible annual recap of bad investment market predictions, he highlights an especially helpful quote from Hannah Arendt, “No matter how much we may be capable of learning from the past, it will not enable us to know the future.”
Inflation
Rising prices seem to be at the top of everyone’s mind. From Social Security recipients wondering if the cost of living adjustments will keep up their actual expenses, businesses and employees wondering how to factor in wage increases, or everyday consumers struggling to keep their energy and food costs under wraps. Congress even joined in with concerns. Last week at the Senate Banking Committee meeting, Federal Reserve Chairman Jerome Powell told lawmakers,
“If inflation does become too persistent, if these high levels of inflation become too entrenched in the economy or people’s thinking, that will lead to much tighter monetary policy from us, and that could lead to a recession, and that would be bad for workers,”
Jerome Powell
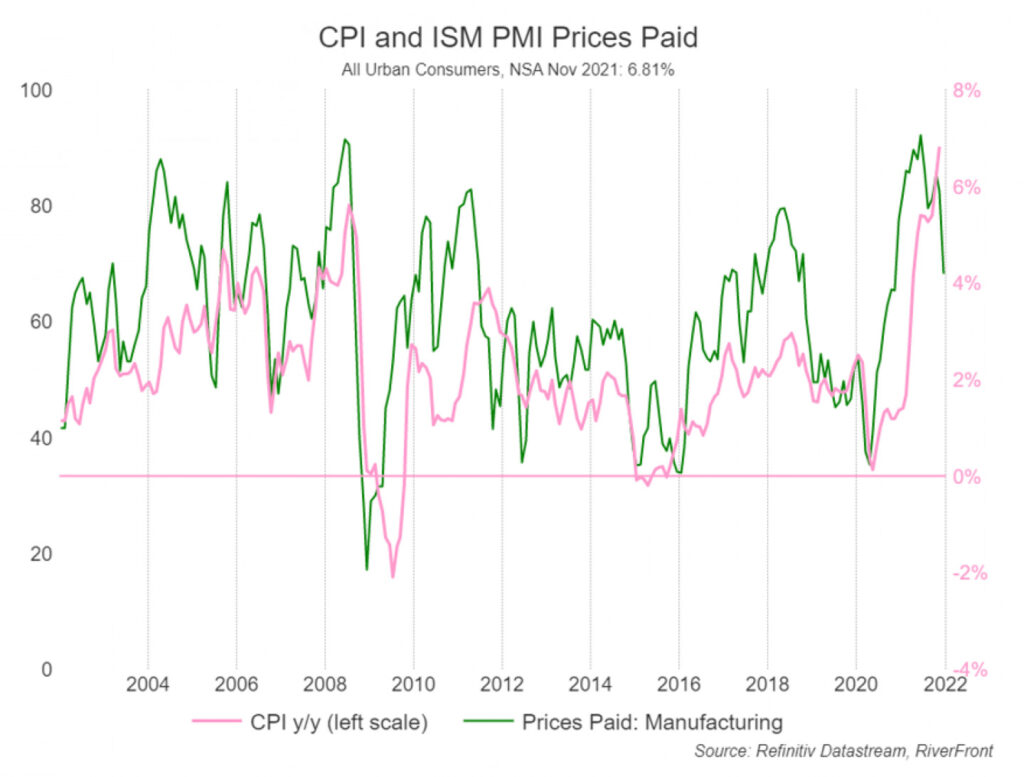
Powell’s remark about “people’s thinking” gets at the heart of inflation concerns. We have data that suggests inflation has peaked (like the chart above from Riverfront’s illustration of the recent drop in Manufacturing Prices Paid, which often precedes a drop in inflation.) But if the perception of businesses, consumers, and lawmakers is that prices will remain high and rise, then it becomes a self-fulfilling prophecy.
A good indication of “people’s thinking” can be found in the Consumer Confidence Survey, which measures consumers’ perception of the buying climate, the national economy, and their own personal finances (below.) After the initial drop due to the pandemic, we’ve seen a fairly steady increase in confidence until the beginning of 2022, when Omicron and Inflation concerns mounted. If you want to get into some of the detail, it is fascinating to see the divide how the last two years have been perceived between Men and Women, Political Affiliations, Race/Ethnicity, and Education Levels. See all of the charts here, then click on CCI BY GROUPS.
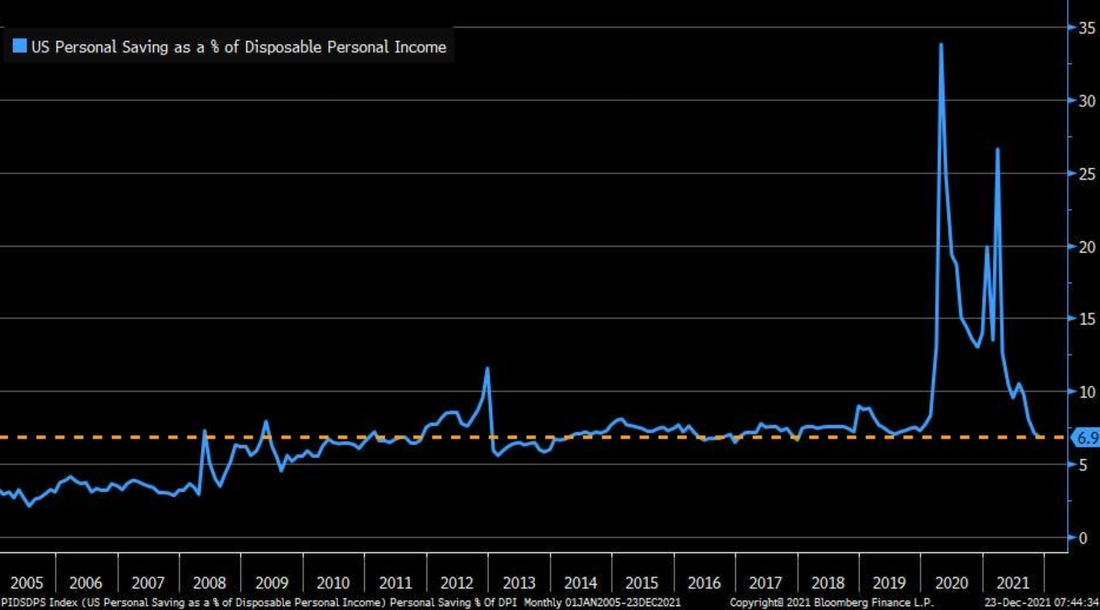
It wouldn’t surprise us to see the Comfort in Personal Finances line (red) drop steadily in the coming weeks and months. As people have tapped home equity, sick leave, savings, and unemployment benefits and are now spending more on goods and services, we see the personal savings rate (below) return to more historically low averages. On a related note, this drop in personal savings and Personal Finance Comfort could also “solve” some of our employment crises by driving more people to look for work.
Fed Rate Hikes
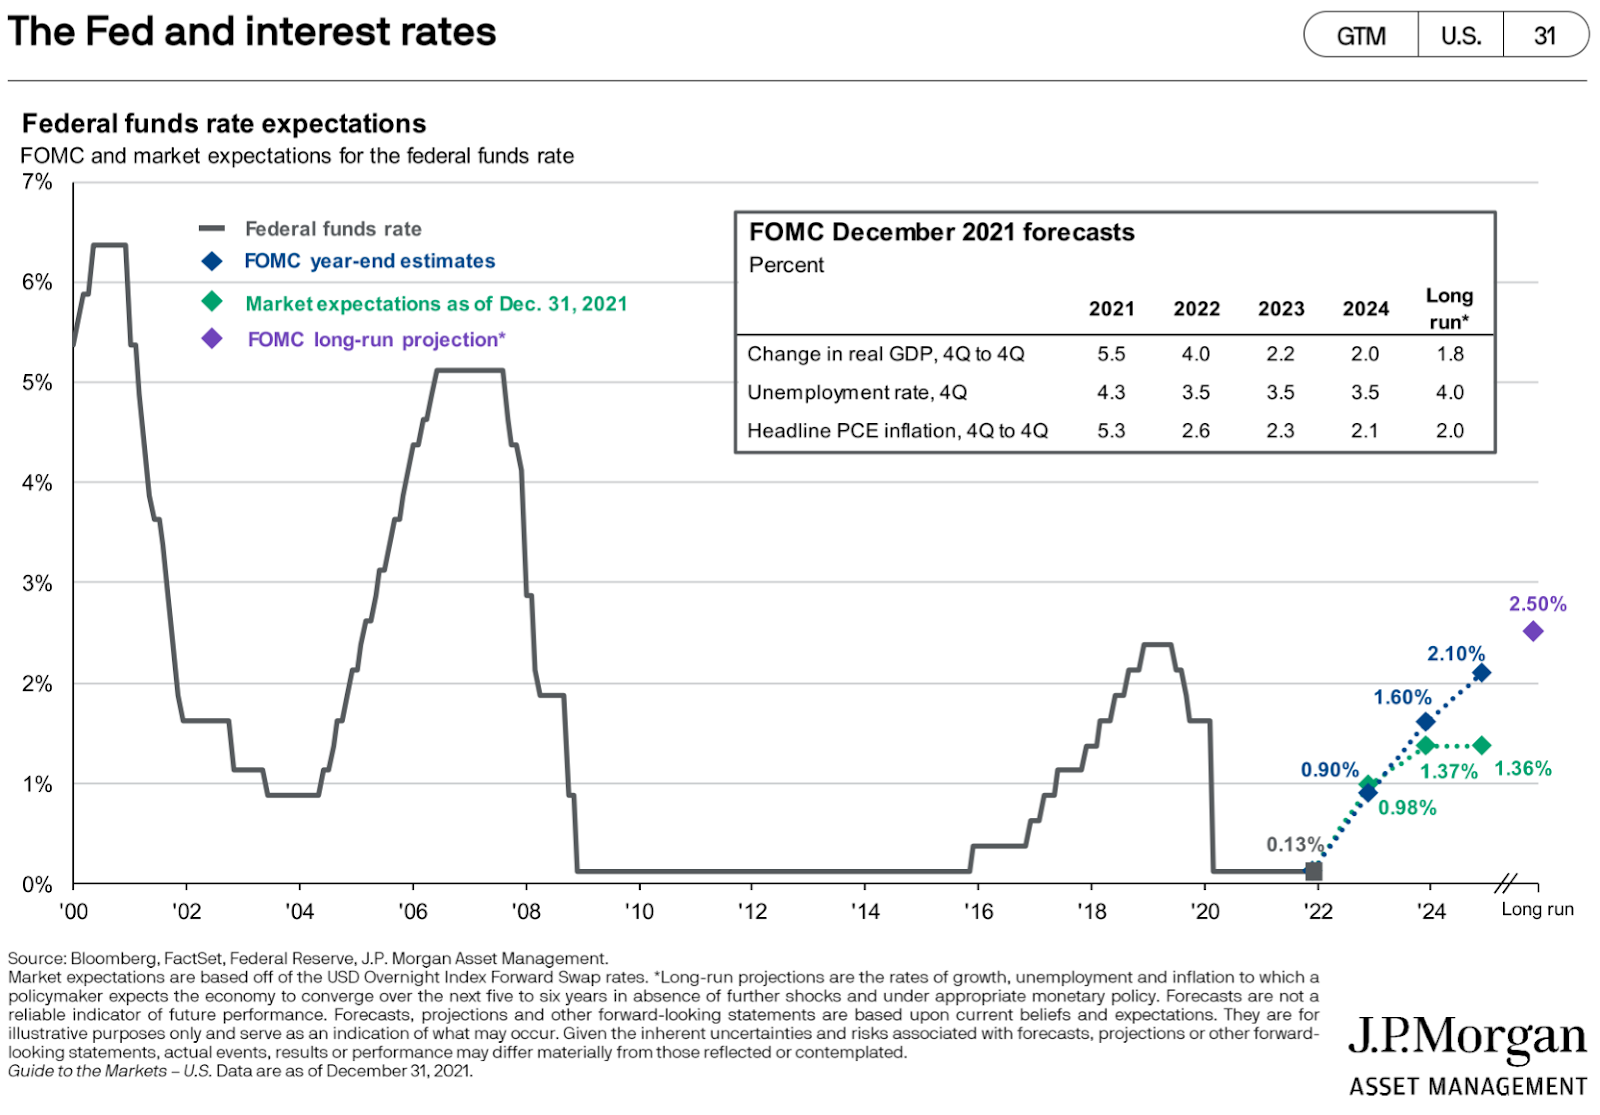
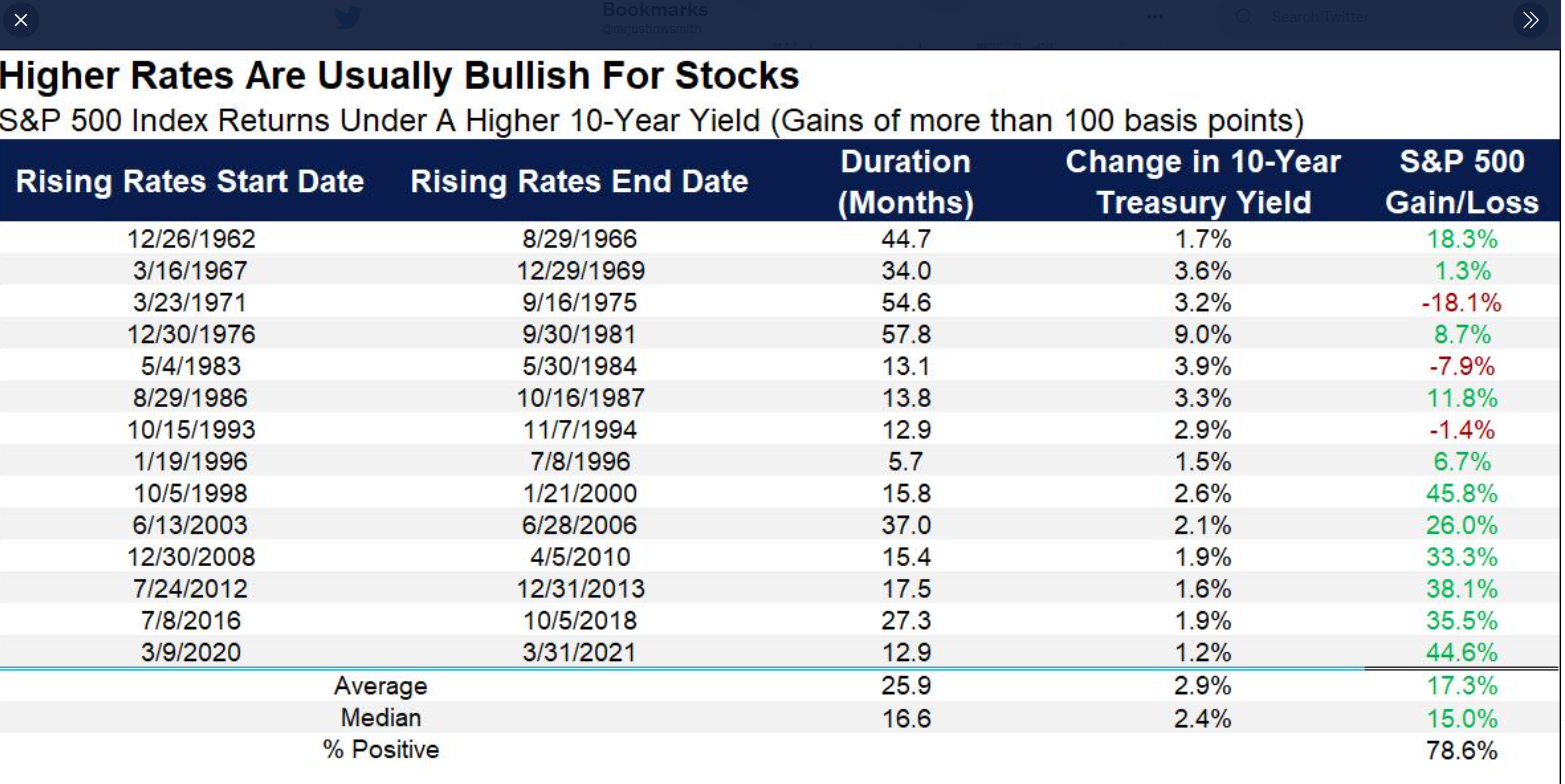
The tighter monetary policy that Chairman Powell mentioned above corresponds directly with higher interest rates. As prices rise, higher borrowing costs can bring inflation to a slowdown. But even if the Federal Reserve and the Market both expect higher interest rates (chart above), that doesn’t necessarily spell trouble for equity markets. LPL’s Chief Market Strategist, Ryan Detrick, looked at the last 60 years to find all periods when 10 Year Treasury Interest Rates rose at least 1%. Typically the rate increases continued for close to two years, and the market gained above historical average returns over the period.
Red Dots and Bad Headlines
One of my favorite charts of all time comes from Michael Batnick at Ritholtz Wealth Management. It might be the closest chart we have to predicting the future. Sadly, I’m not talking about the direction or magnitude of S&P 500 returns. Rather, we know with certainty that the future will have many more red dots and bad headlines. Some of them like “Trade War” and “US Election” will most certainly repeat.
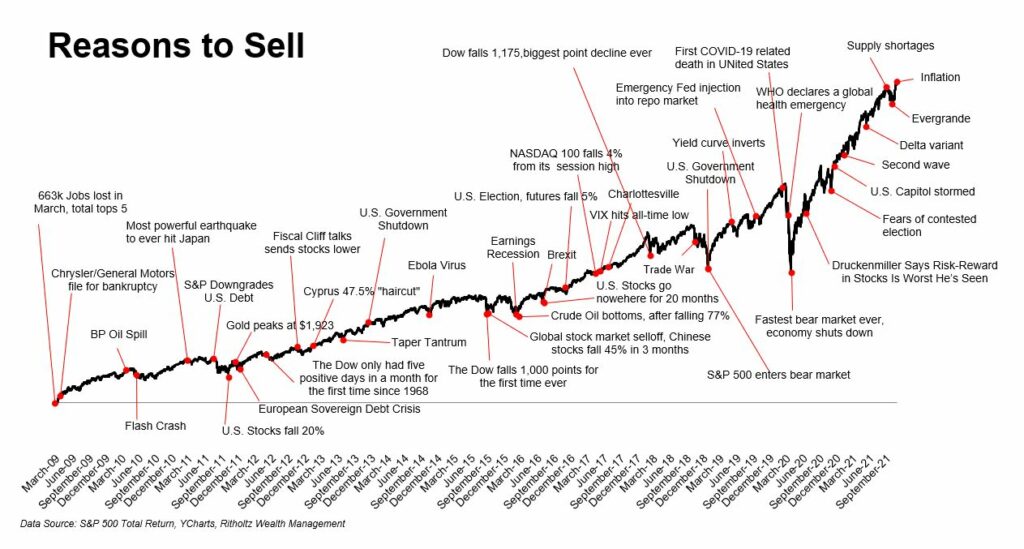
As I wrote in our Q3 2018 commentary (right around “Trade War”, “Government Shutdown”, and “S&P 500 enters Bear Market” in the chart above) the pain in the market is actually our “old friend.” Over the last 100+ years, equity investors have earned good returns because of bad headlines, not in spite of bad headlines. If there were never pain in the stock market, it would be called the bond market, and the returns would be lower.
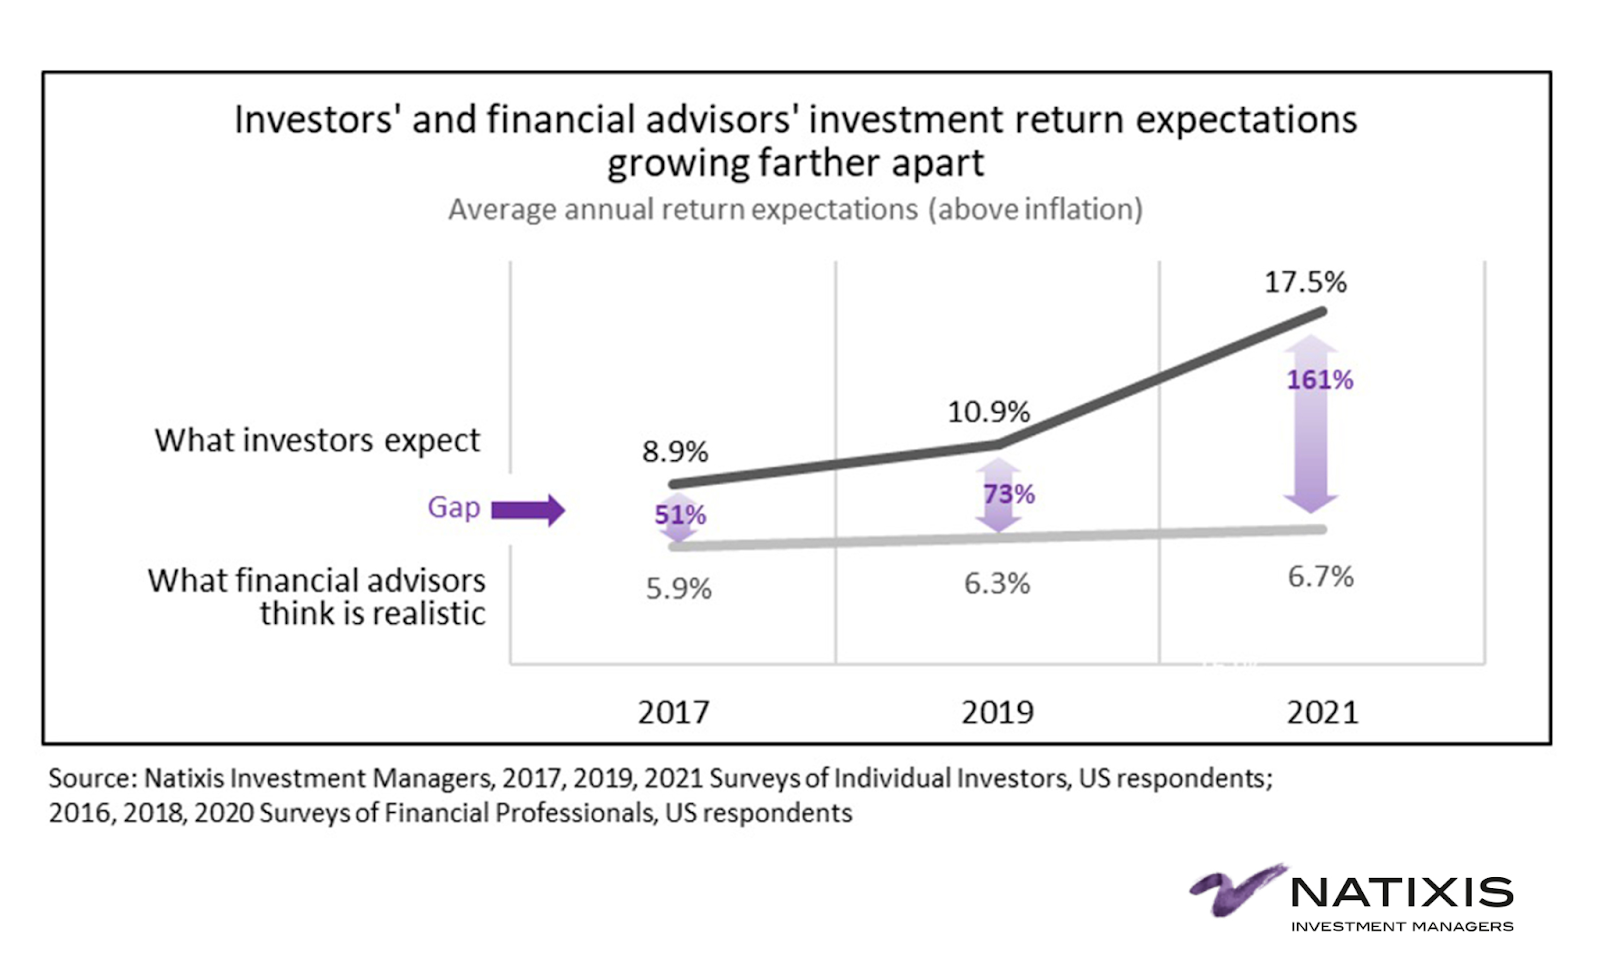
The potential for risk is what creates the prospect of reward. One of our most challenging jobs as investors is to remember that we are co-owners with Mr. Market, who often only believes the worst (chart above) or the best (chart below) when the truth is often somewhere in the middle.


Justin Smith
Latest posts by Justin Smith (see all)
- Tariffs and a Declaration of Parental Independence - April 11, 2025
- Quarter in Charts – Q1 2025 - April 11, 2025
- Quarter in Charts – Q4 2024 - January 22, 2025