Quarter in Charts – Q4 2024
When we consider the possible variations within a financial plan (investment markets, job changes, health concerns, family dynamics, etc.), we like to say, “It’s better to prepare than to predict.” It would be hard to find a year that defied predictions more than 2025.
In the most recent update to his Annual Forecasting Follies, Bob Seawright recaps the year’s worst predictions. While Seawright focuses on investment and economic predictions, I must say that I appreciate how he highlights historically bad forecasts in almost all areas of life. Seawright mentions some very smart forecasters who predicted the demise of some of the very pillars of our daily lives: capitalism, the smartphone, e-commerce, and the internet.
As a baseball fan, my favorite prediction was that LA Dodgers pitcher and designated hitter Shohei Ohtani was “basically like a high school hitter.” This year, Ohtani logged the first 50 home run/50 stolen base season in MLB history, capping it off with arguably the greatest single-game performance ever.
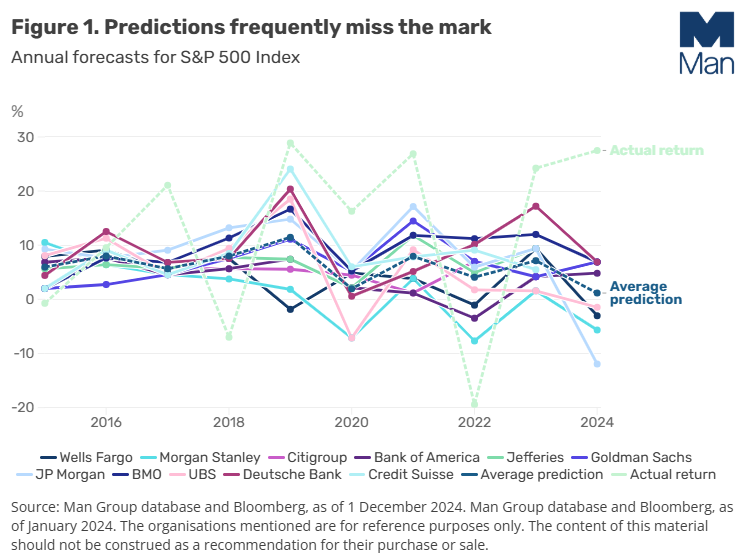
A year ago, Wall Street analysts predicted much lower-than-average returns for the S&P 500 (navy dotted line below in the chart from Man Institute). Seeing how the prior handful of years’ predictions panned out, it should be no surprise that Wall Street got it wrong again.
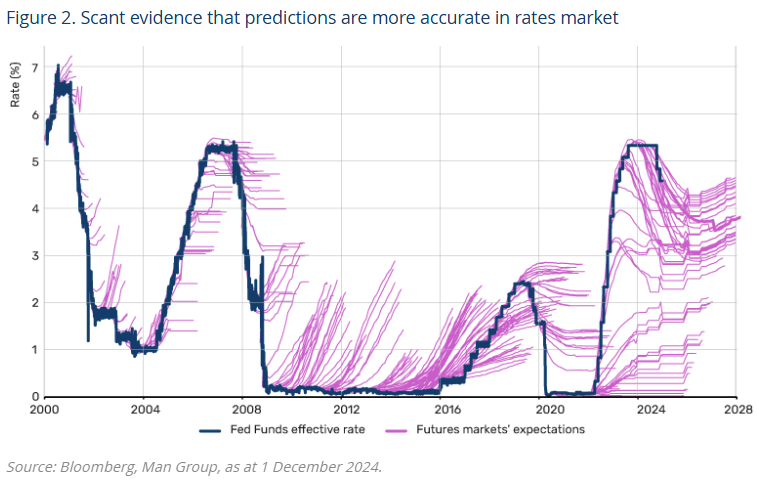
On the Bond front, future markets predicted four to five interest rate cuts starting in March. In reality, we only had three rate cuts, with the first not coming until September. Fed rates are hard to predict, as seen below by the futures markets’ prediction in pink versus the actual rates in blue.
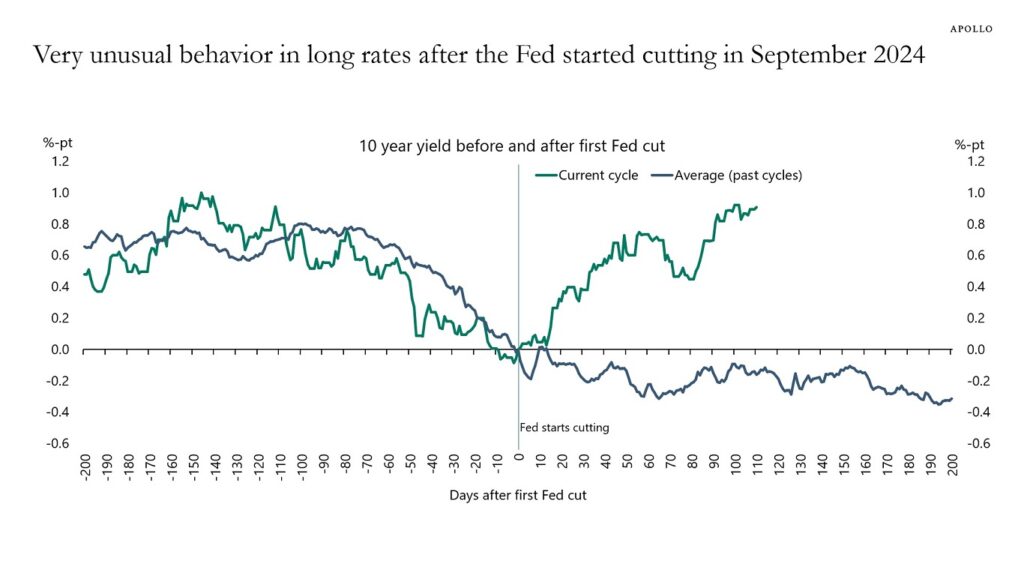
However, to add insult to the prediction injury, even if investors could have predicted what would happen to short-term Fed Funds rates, they would have had a more challenging time predicting that the longer-term bond markets would react so counter to history. The following chart from Apollo Academy shows that in the months following an initial Fed Funds rate cut, actual longer-term market interest rates tend to fall, and bond prices rise (see blue line below.) However, bond investors experienced an abnormally opposite effect in 2024 of rising interest rates and decreasing bond prices.
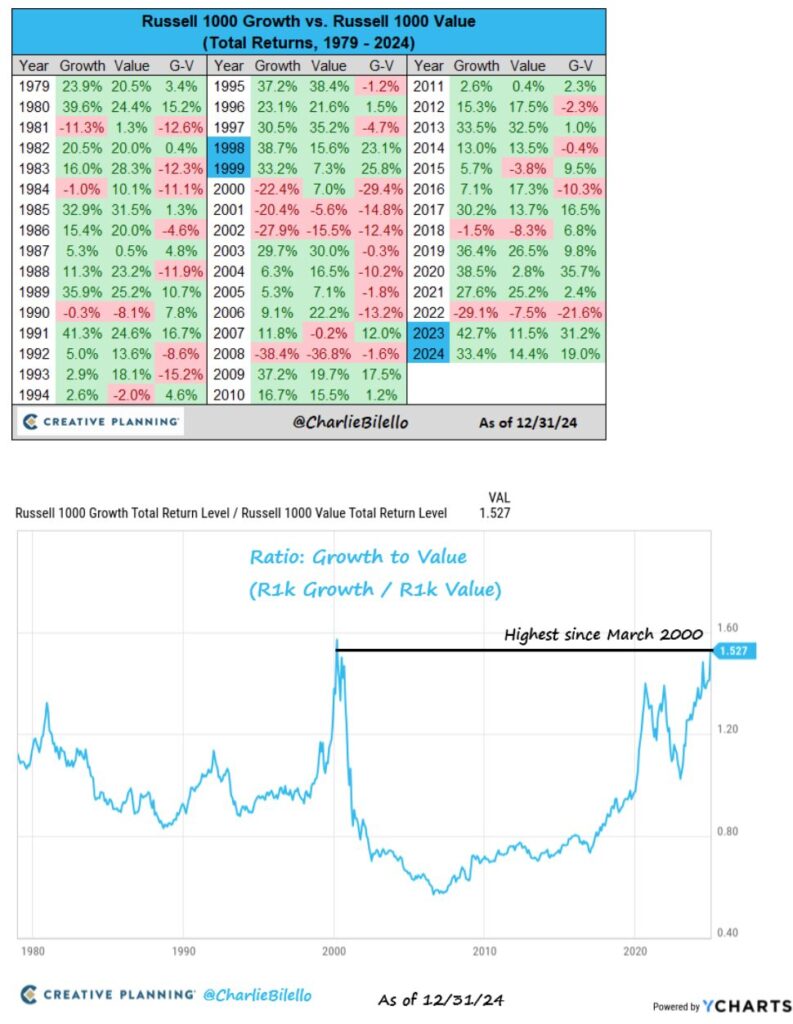
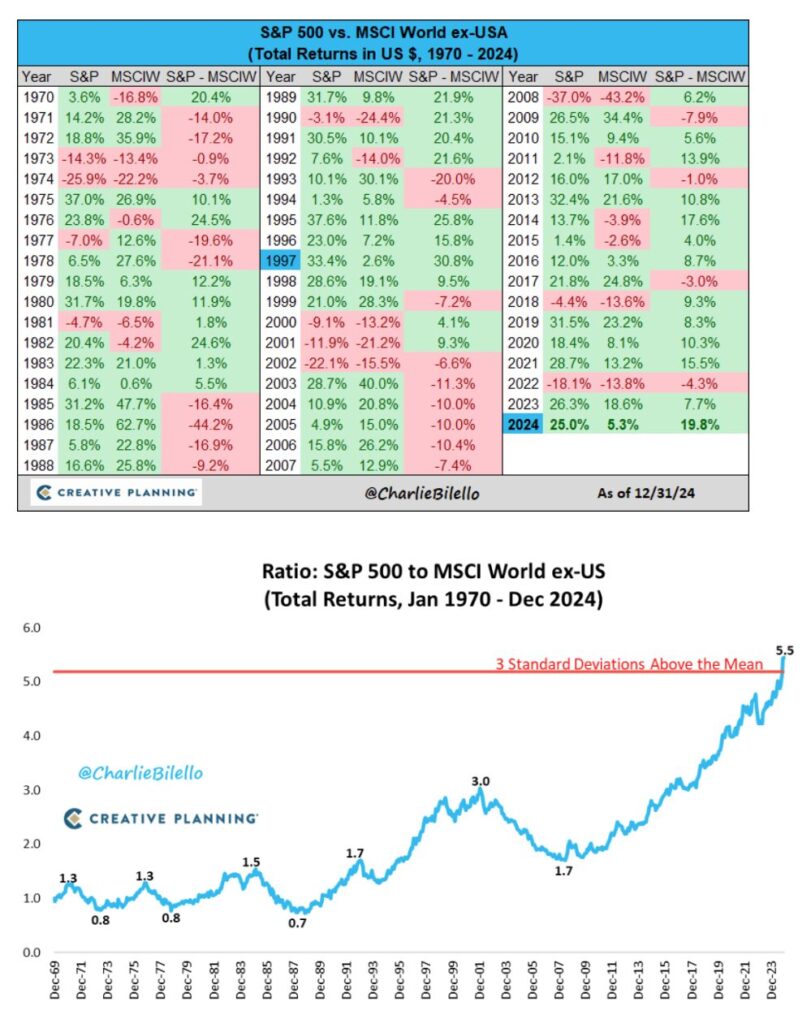
While I wouldn’t call the following “predictions” per se, Investors in 2024 experienced continued probability-defying returns for Growth over Value and US over Foreign equity returns.
Creative Planning’s Charlie Billello details the volleying relationship between Growth and Value over the last 45 years in his 2024 Year in Charts and below (see the G-V columns). Investors have never experienced a period of continued US Growth outperformance over US Value like we’re seeing now.
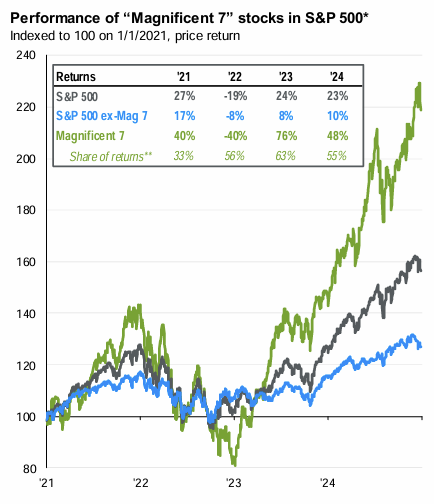
This outperformance by Growth has been fueled by the Magnificent 7 tech stocks, which we’ve detailed in prior commentaries and can be seen below.
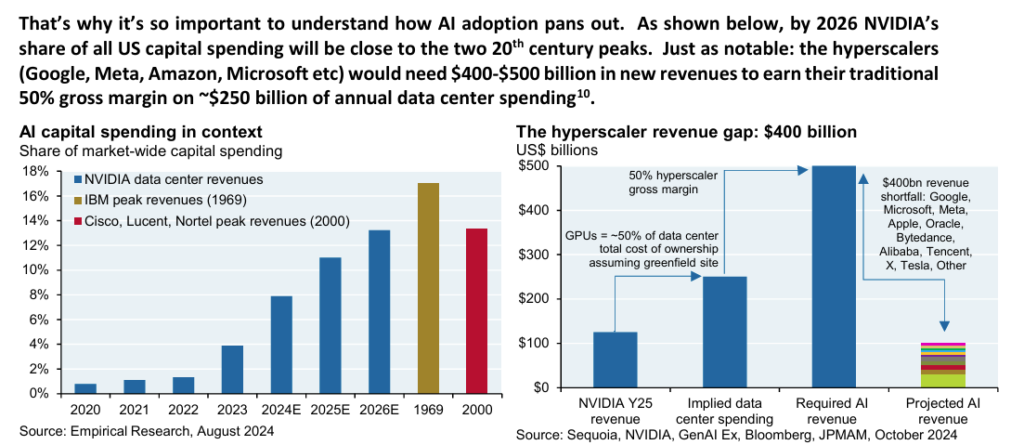
It’s easy to see how AI and the information revolution could make companies more profitable with fewer costs, but is there a theoretical limit? JP Morgan’s Michael Celmblast deduces that the main users of AI data centers would need to grow revenues at an unprecedented rate to justify the capital spending and current stock prices (see charts below.) For more perspective on this, you might enjoy Oaktree’s Howard Marks piece “On Bubble Watch,” in which he compares investing through the Dot Com bubble to today.
Not surprisingly, these US-based Magnificent 7 have also contributed to the growing outperformance of US over Foreign equities (see the S&P – MSCIW columns.)
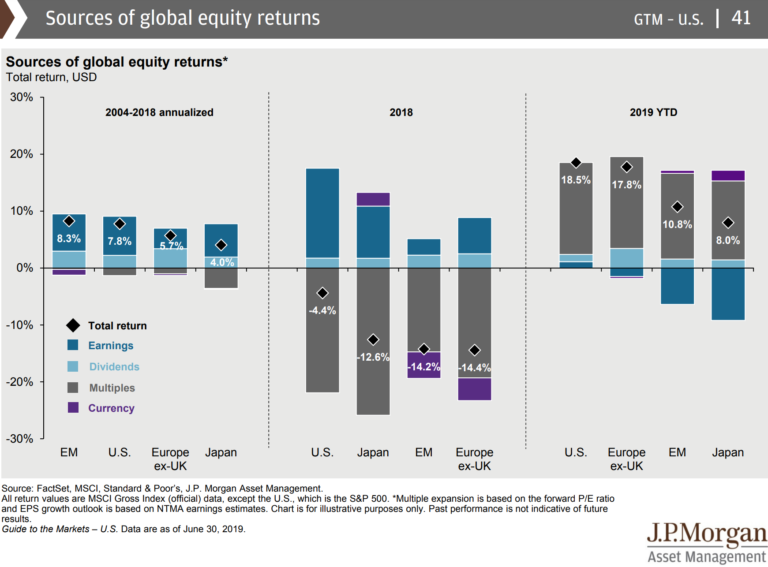
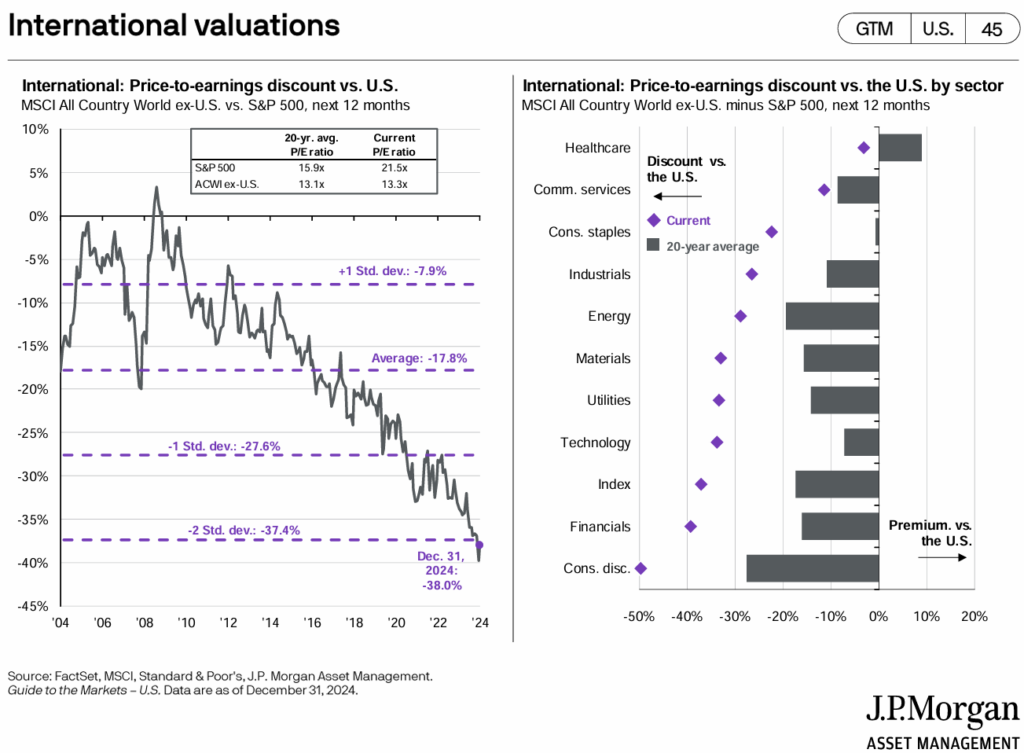
And while earnings for US companies have outpaced their Foreign counterparts, the market value increase is almost exclusively due to valuation increases (investors’ willingness to pay higher prices for a dollar of earnings.) We see this in the chart on the left below from JP Morgan. Over the last 20 years, US stocks have sold for 15.9x earnings, while Foreign stocks have sold for 13.1x. This difference can be justified by any number of factors (the US has faster innovation, better regulations, easier lending, etc.), but the current P/E ratios are 21.5x and 13.3x for US and Foreign, respectively. This -38% discount is two standard deviations below the average.
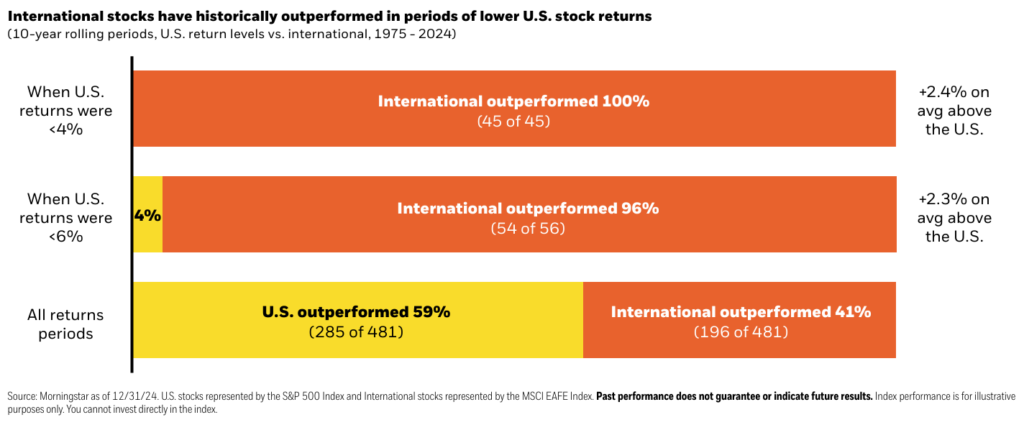
Maybe we’ve entered a new world where the US “always” outperforms. But before we assume that, it’s worth looking at the last half-century. Blackrock recently published data about the last 50 years of US and Foreign stock performance. Over that time, US stocks outperformed Foreign stocks in 59% of all rolling 10-year periods (i.e. January 1975-1985, February 1975-1985, etc.)
However, during “really bad decades” for US stocks (any rolling 10-year period when US returns were below 4% annually), Foreign stocks outperformed US stocks 100% of the time.
And when US stocks had just a “below average decade” (any rolling 10-year period when US returns were less than 6% annually), Foreign stocks still outperformed 96% of the time. While this relationship may not happen going forward, Foreign stocks have historically been a great alternative during times of lower US stock returns.
Last week, we got our first somewhat “sledable” snowfall in the last few years and the neighborhood kids flocked to the sledding hill to make the most of it. Finley (age 15) convinced me to bring our skateboard ramps by using one of my favorite phrases against me, “What’s the worst that could happen?”

Initially, I didn’t want to haul the ramps to the sledding hill, but the risk of missing out on “core memories” outweighed the risk of a broken arm, so I put the ramps in my truck, and they were the hit of the neighborhood. However, the risk of a lawsuit also meant I resisted the neighbors’ pleas to leave the ramps at the park when we called it a day.
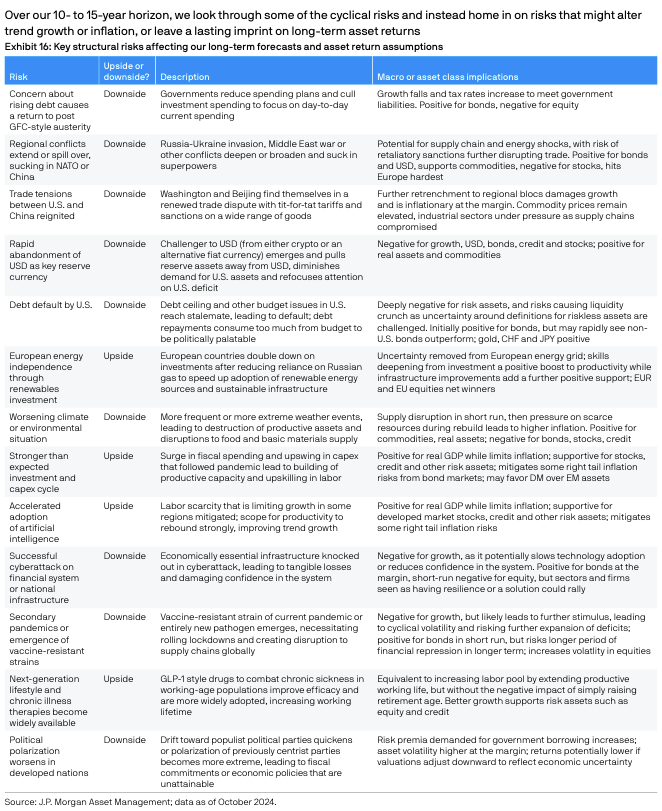
JP Morgan recently published a breakdown of “What’s the worst that could happen?” over the next 10-15 years (below). There are plenty of risks to the downside (rising debt, US default, etc.) but also plenty of risks to missing out on the upside (AI adoption, innovation in healthcare, etc.)
As exhaustive as this list seems, it doesn’t come close to accounting for all of the risks to a financial plan. In addition to unknown investment risks missing from the list (who would have put “Global Pandemic” or “Missing out on AI” on their risk list 10 years ago?), we also have to contend with life events like job changes and health concerns or systemic events like evolving tax laws and social security shortfalls.
On top of those quantifiable risks (that are still difficult to quantify), we must consider the risks that are hard to translate into numbers:
- What if this new job allows me to achieve my goals quicker but sucks the life out of me?
- What if helping my family members financially ends up hurting our relationship?
- What if I saved a little less (or more) and enjoyed life a little more now (or later)?
- What if, what if, what if…
Walking through the ever-changing “What ifs” is at the core of ongoing financial planning. We don’t know how the future will unfold, but we look forward to helping clients consider, evaluate, and talk through the possibilities together.
