Quarter in Charts – Q3 2023
In this Quarter in Charts, we have several graphs detailing the current interest rate environment, global market events, the bond bear market, and various economic indicators. We use this data to explain what happened (and look ahead to what could happen) in economies, markets, and investment portfolios.
But none of those graphs will be able to explain or predict “financial success” nearly as well as these three from Mark Brooks, President and COO of Permanent Equity, as he describes our relationship with “stuff” (note, he’s not talking about basic needs like food, healthcare, and shelter.)
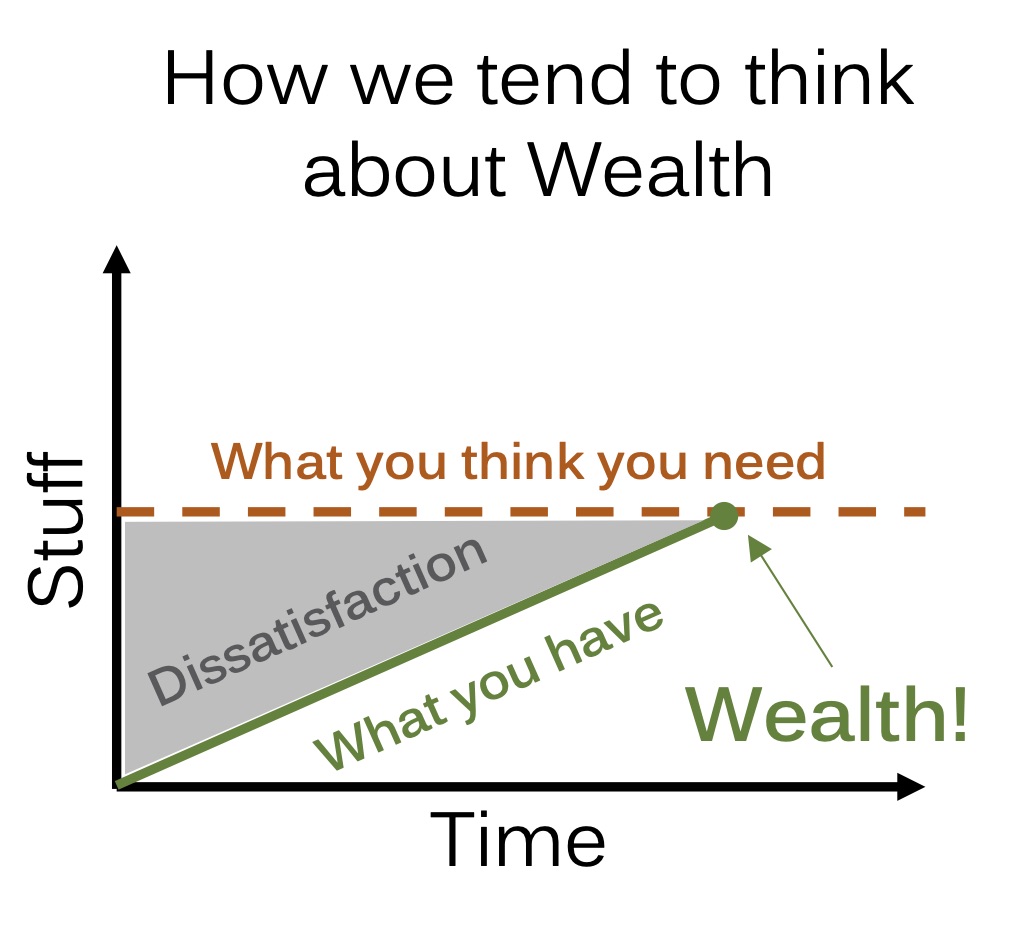
Brooks illustrates that we often define Wealth as “finally having what we think we need in the Stuff department.” And until we reach that point, we’re usually in the gray area of dissatisfaction.
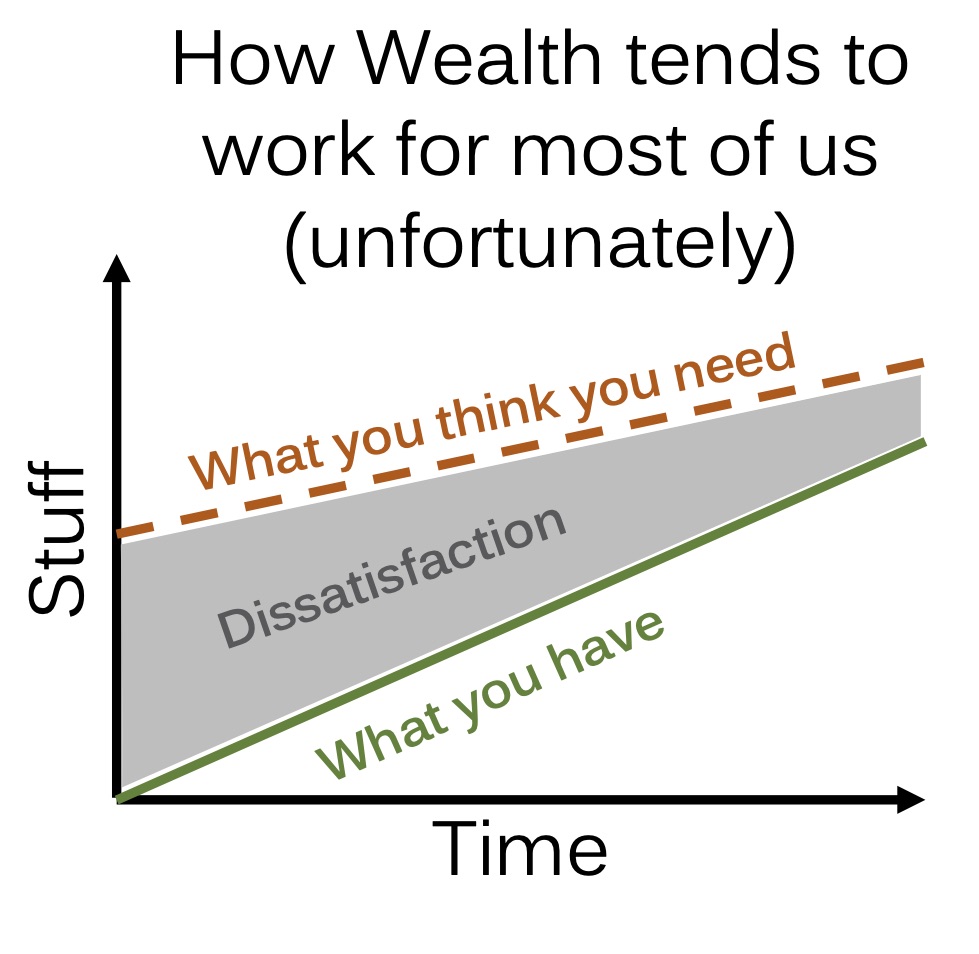
Brooks’ astute observation is that the “Stuff we think we need” tends to be an ever-moving goalpost, creating in us a state of permanent dissatisfaction.
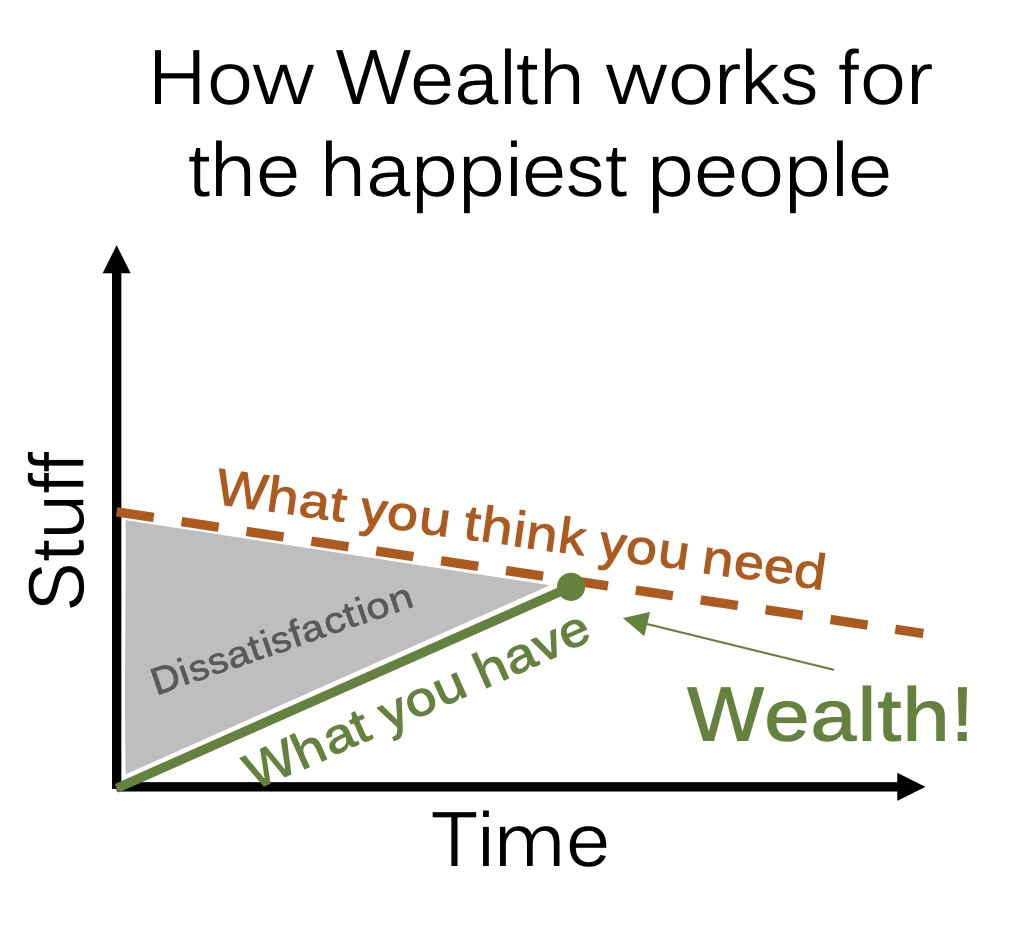
The double-edged great/hard of this Wealth dynamic is that I am the only person who can define “what I think I need.” Too often, “what I need” is inherited or influenced rather than intentionally considered. We’ve talked about this plenty before (read “Am I Rich?”) but I’ve never seen it explained so well in chart form.
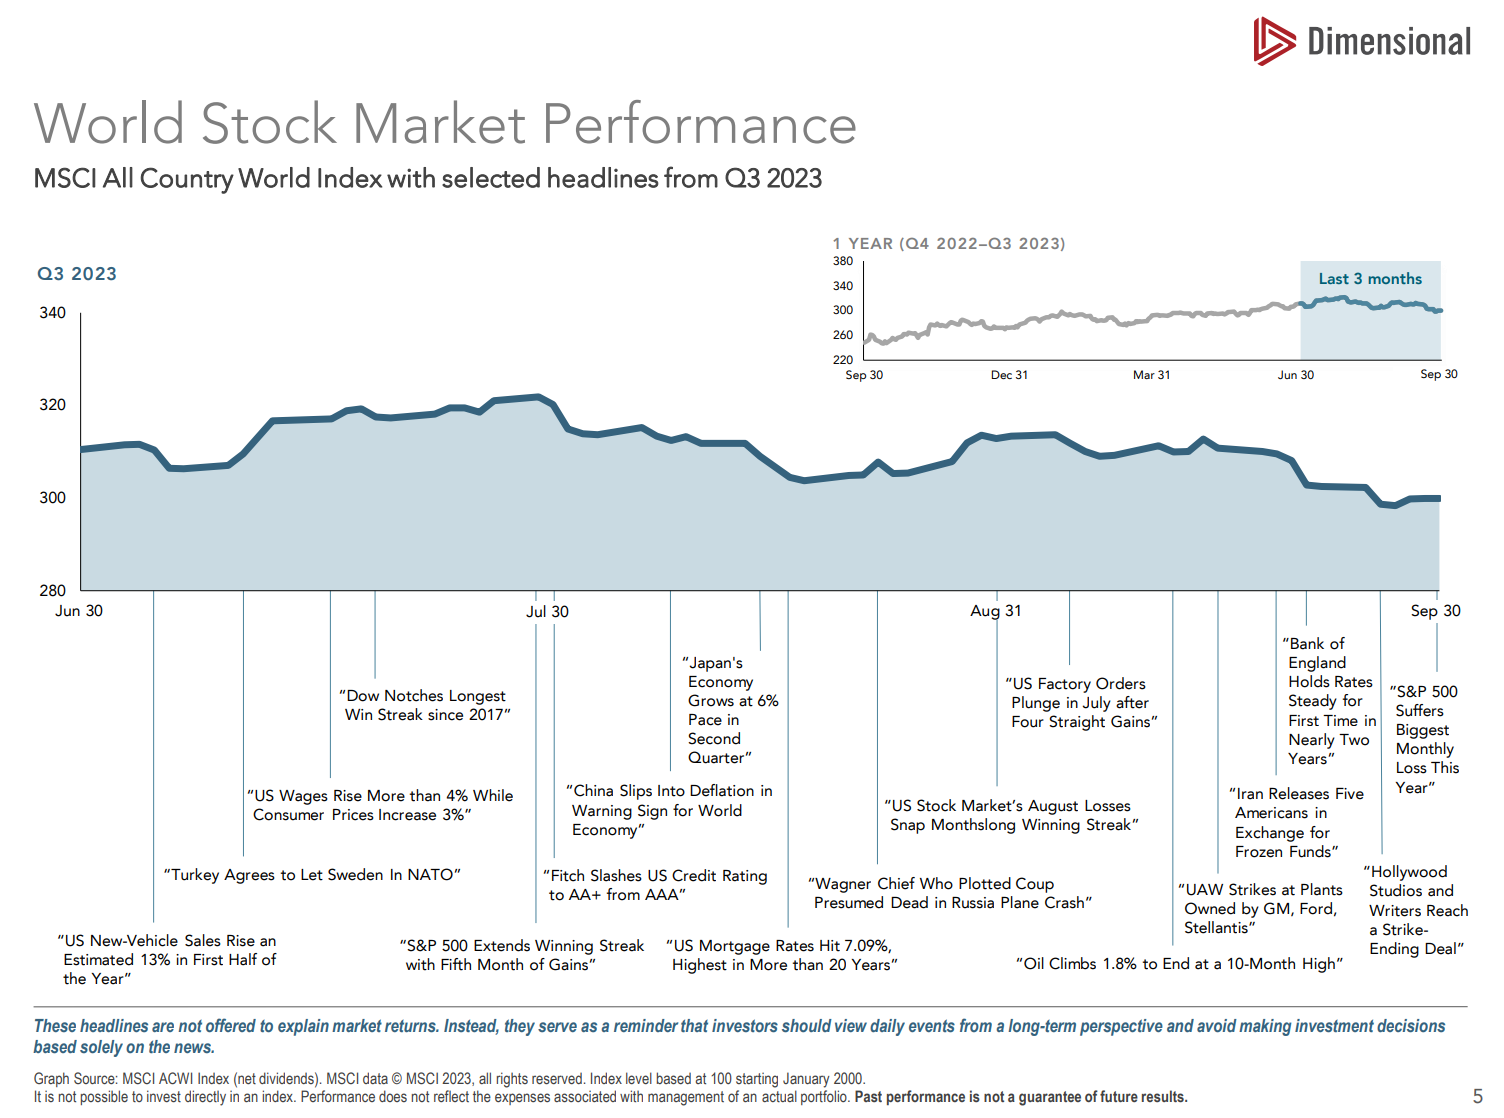
Over the last quarter, we’ve experienced a US credit downgrade, mortgage rates at 20-year highs, and the first interest rate pause from the Fed after an 18-month blistering string of rate increases. All of these events have an impact on the green “what you have” line. They are worth paying attention to, but they are also impossible to control or predict with any level of certainty.
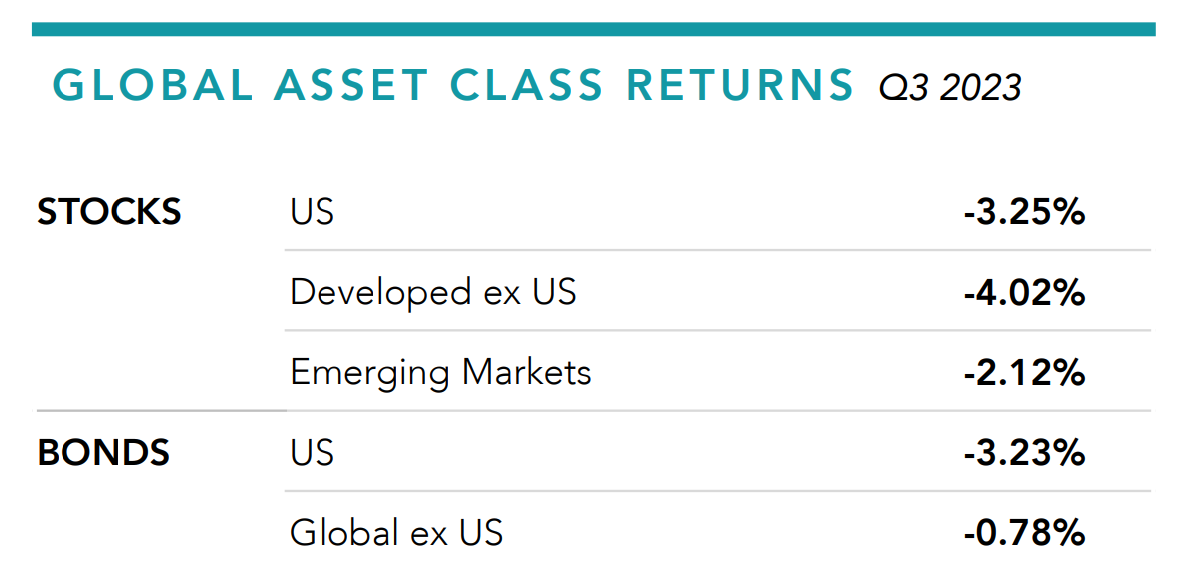
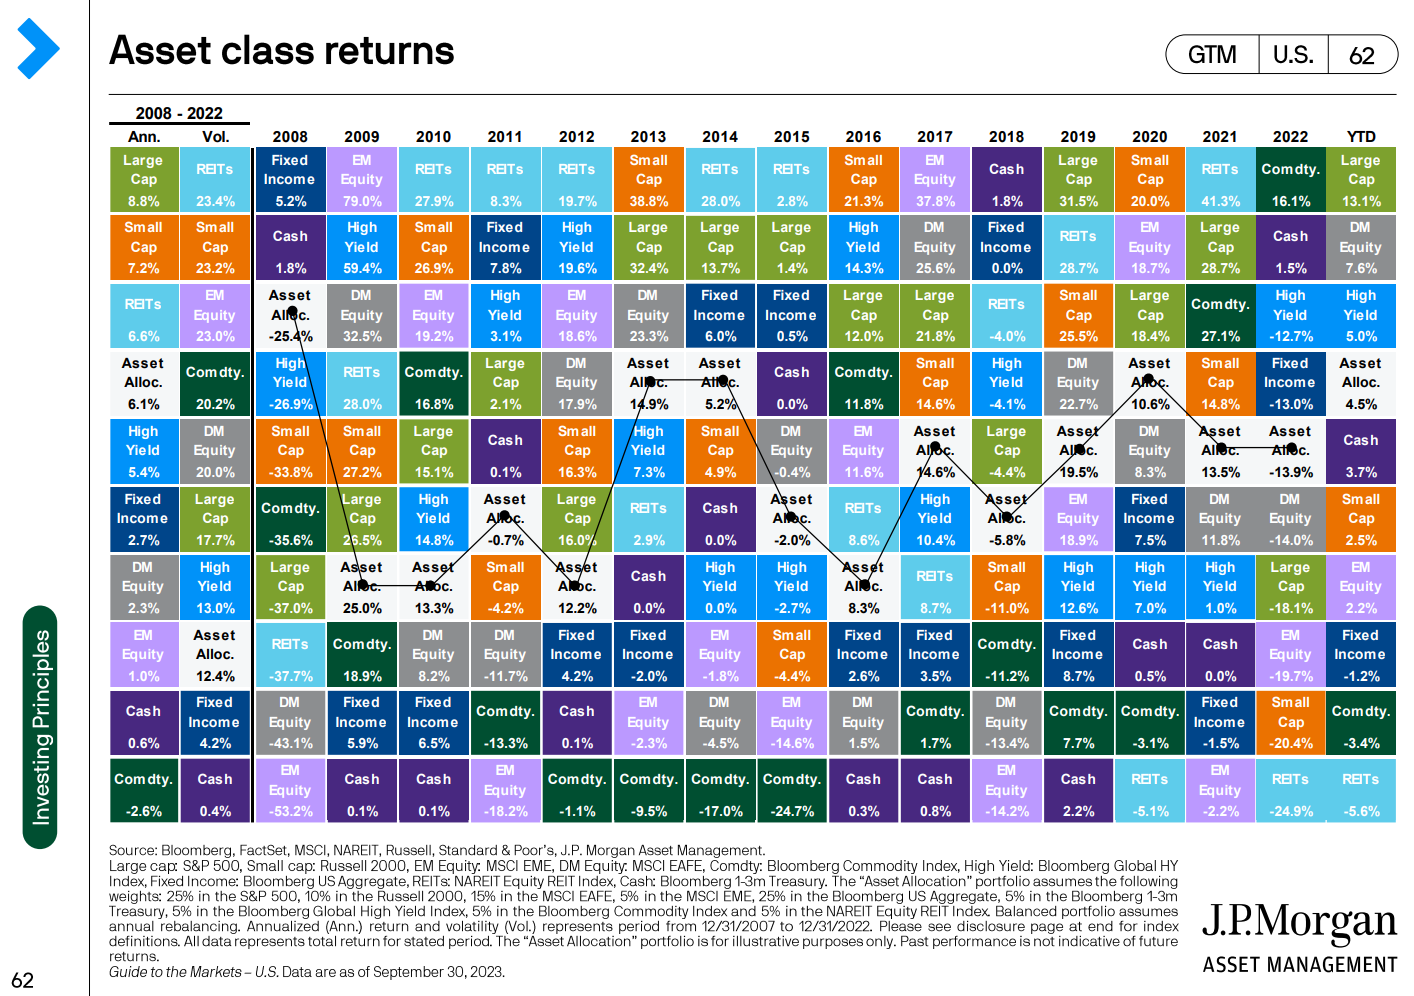
For the 3rd Quarter, all major asset classes declined (first chart below) while only Bonds, Commodities, and Real Estate are negative for the 2023 calendar year to date (second chart below, far right column.)
As we consider where US Stock returns have come from through the third quarter of 2023, we can see in the chart below (from Creative Planning’s Charlie Bilello) that the largest stocks, by market capitalization have contributed that majority of the gains.
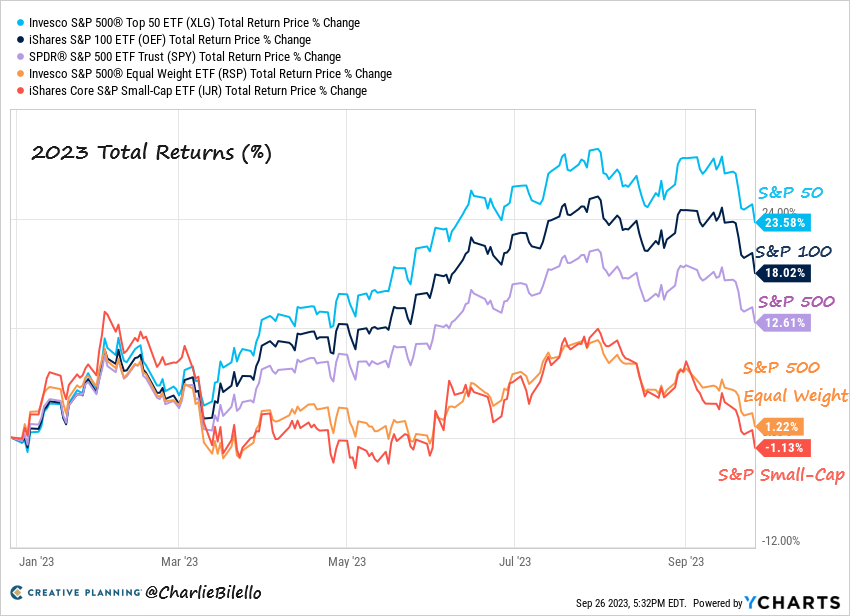
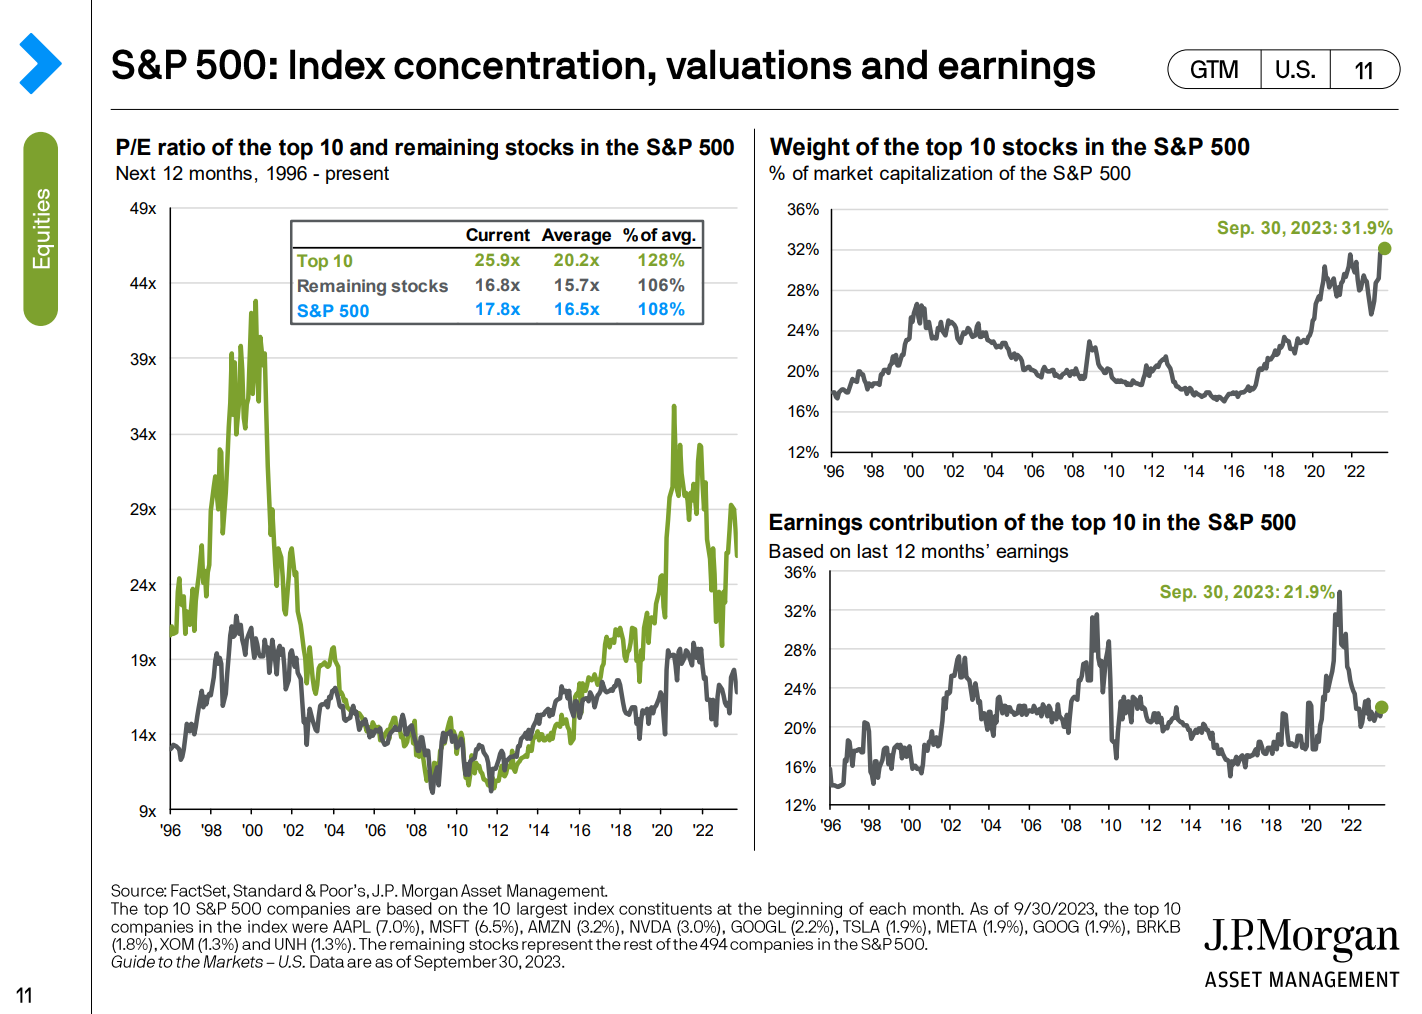
That isn’t surprising, given that the top 10 largest stocks (which is just 2% of the 500 stocks that make up the S&P 500) account for 31.9% of the total market value of the S&P 500 and 21.9% of all earnings. While this phenomenon has added value to traditionally diversified portfolios, it can also cut both ways if those same stock prices come down.
At some point, I’m sure we’ll have a quarter without “historic” events…but the third quarter of 2023 wasn’t one of them, especially for bonds. As the Fed continued raising interest rates, the US Aggregate Bond index continued its longest and most severe drawdown since the beginning of the index in 1976 (chart below, again from Bilello.)
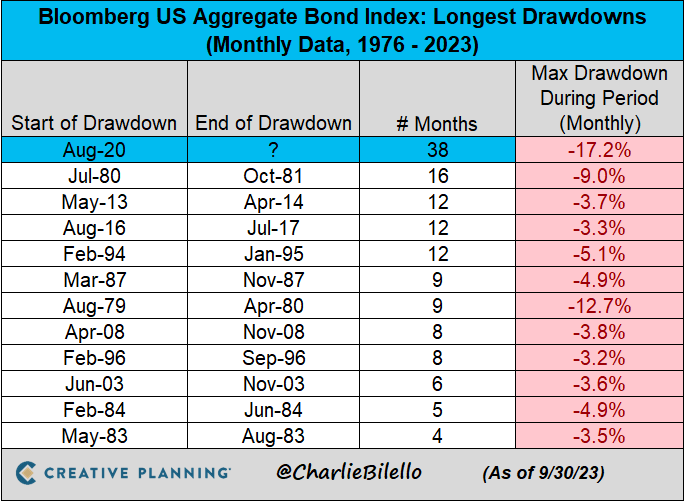
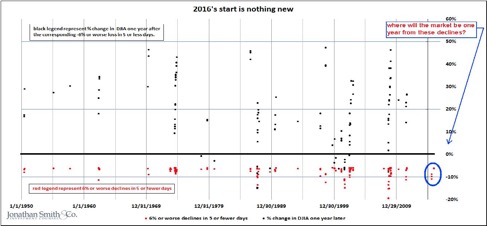
Over short periods of time, bond prices can bounce around wildly (though no downturn has been as dramatic as what we’ve experienced over the last three years.) But in the longer term, bond investment returns tend to walk along narrower, more predictable paths.
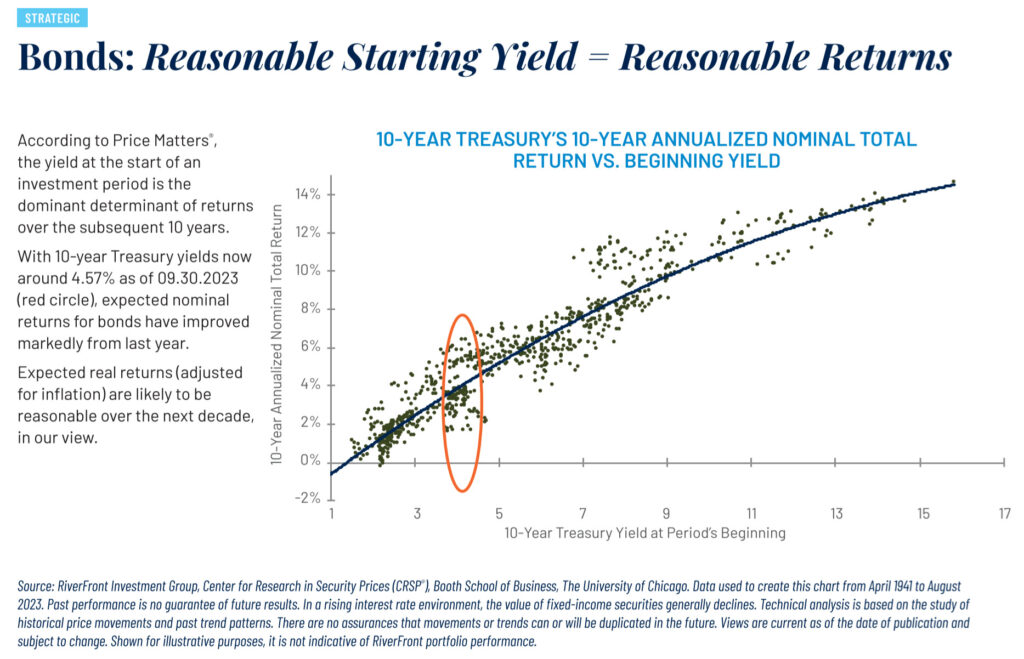
Below, RiverFront Investment Group plots the starting yield for 10-year US Treasuries over the last 82 years (x-axis across the bottom) and the resulting 10-year return that followed (vertical y-axis.) For the most part, an investor’s 10-year return was very close to the yield promised when they purchased the bond, as seen in the solid regression line.
The circled area is our current starting yield for 10-year Treasuries, 4.57% on 9/30/23. The data shows that investors who started buying (or stayed invested in) Treasuries at times like these (all of the dots within the circle) earned 10-year annualized returns ranging from ~2% to ~7%. After the worst bond market in our lifetimes, it is hard to see how long term future returns stray far from history. As Morningstar’s John Rekenthaler wrote, “At long last, bonds once again matter.”
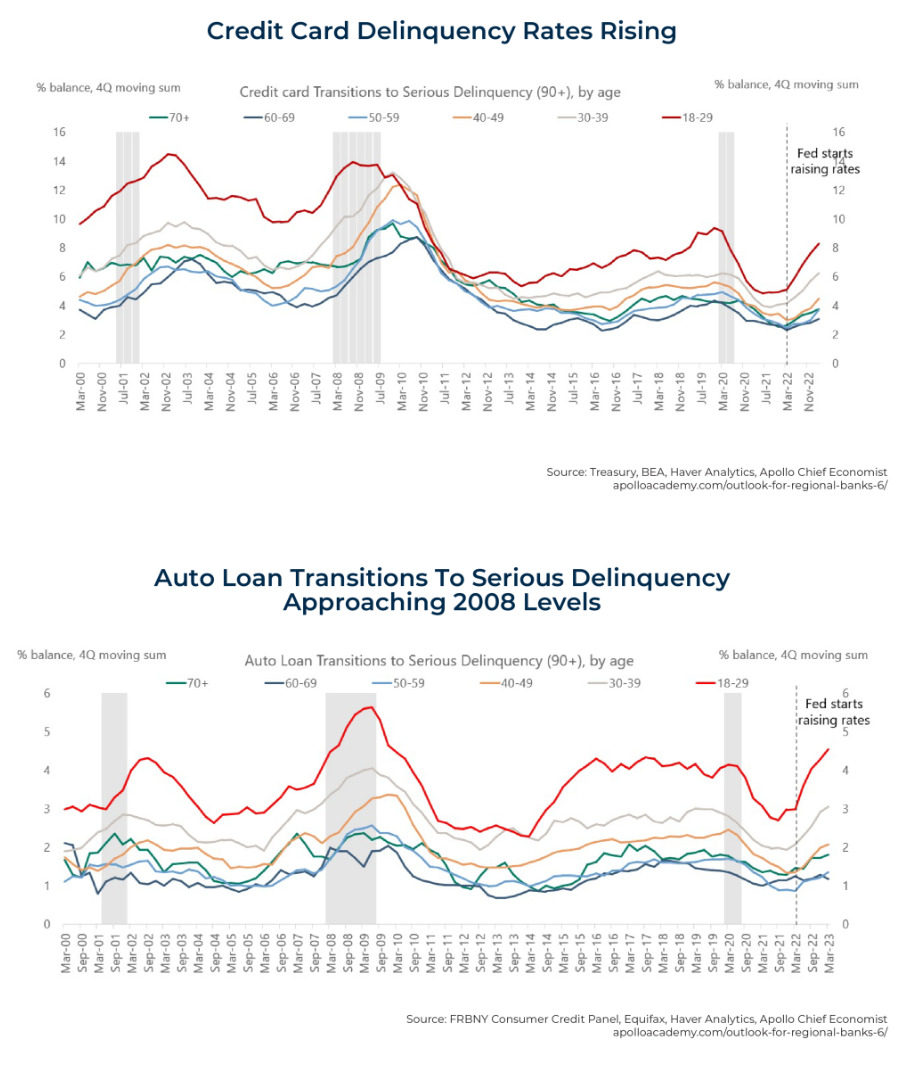
We’ve seen both encouraging and discouraging indicators regarding the economy and the likelihood of a recession. The US consumer is coming under some strain with increasing credit card and car payment delinquencies, along with oncoming student loan resumption.
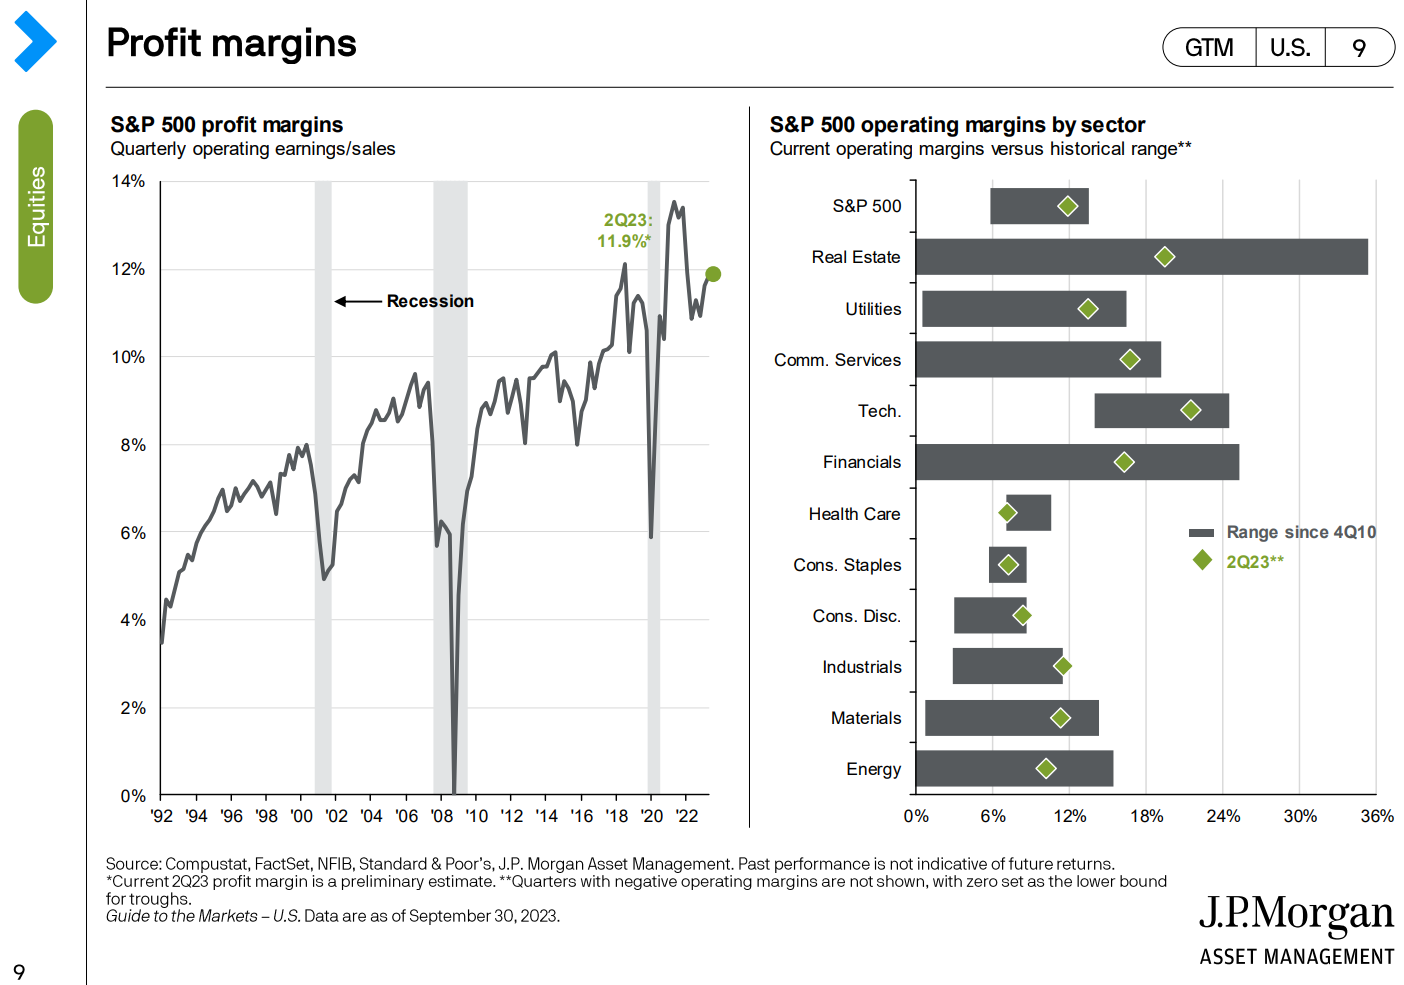
However, unemployment is still low and inflation has slowed considerably, meaning the Fed likely shouldn’t have to continue tightening by raising rates. Company profits are strong (below) and a soft landing could provide a path forward for equities.
Regarding predictions of recession, the relevant consensus for the fourth quarter of 2023 is still below 50%. We’ll close with a quote from Barry Ritholtz as he recounts an observation that probably isn’t far from the truth (from “Can Economists Predict Recessions?”)
“I like the old joke among economists and statisticians: When asked to make a forecast about a future recession, your answer should always be “about 40%.” Why? 50/50 is just a coin flip, so that’s useless; 75/25 is too one-sided. 40% is the Goldilocks forecast.
What makes the 40% forecast so useful is you appear to be correct regardless of which outcome occurs. If a recession doesn’t happen, you can always say “As I expected, a recession was the lower probability event, and did not occur.” If it does happen, your warnings were prescient, and you warned of a very real (e.g., 40%) probability of happening.”


Justin Smith
Latest posts by Justin Smith (see all)
- Tariffs and a Declaration of Parental Independence - April 11, 2025
- Quarter in Charts – Q1 2025 - April 11, 2025
- Quarter in Charts – Q4 2024 - January 22, 2025