Should I Invest a Lump Sum Today, Tomorrow, or Over Time?
This year we’ve been working through an unusually high number of lump sum investing scenarios with clients. No one has won the lottery or discovered a long-lost rich uncle who left them an inheritance. Rather, what we’ve encountered falls into two categories: a) an influx of cash (sale of a business, receipt of deferred compensation, large bonus, etc.), or b) new clients who want to get back into the market after having been invested in cash or lower-risk assets.
Which brings the inevitable question: “Do we invest it all today…or tomorrow…or over time?” While the same math governs all scenarios, each one seems to carry a different set of emotions. We’ll tackle the math first and the emotions later.
What Would a Computer Do?
Nick Maggiulli at Ritholtz Wealth Management recently wrote a great and extensive blog post on the topic. He looked at buying a 60/40 (stocks/bonds) portfolio all at once (Lump Sum) versus over time, also known as Dollar Cost Averaging (DCA).
Looking at 60 years of data, Maggiulli discovered that if an investor put their money into the market gradually over a 12 month period (DCA), they would have underperformed the lump sum choice 80% of the time to the tune of -3.7%. Furthermore, he points out that if an investor chose to Dollar Cost Average and happened to be “right” (which could happen 20% of the time) their rate of outperformance wasn’t significant.
I encourage you to read the full blog post, How to Invest a Lump Sum (which includes some fascinating charts.)
Flip a Coin
If Nick Maggiulli’s deep dive is a bit hard to comprehend, it might be helpful to think about it in terms of a coin flip. (NOTE: While most people have a diversified portfolio like the one modeled above, we’re going to look at just the S&P 500 below, because US stocks are the major source of both risk and return for most investors.)
Short Term: Heads I Win, Tails I Lose
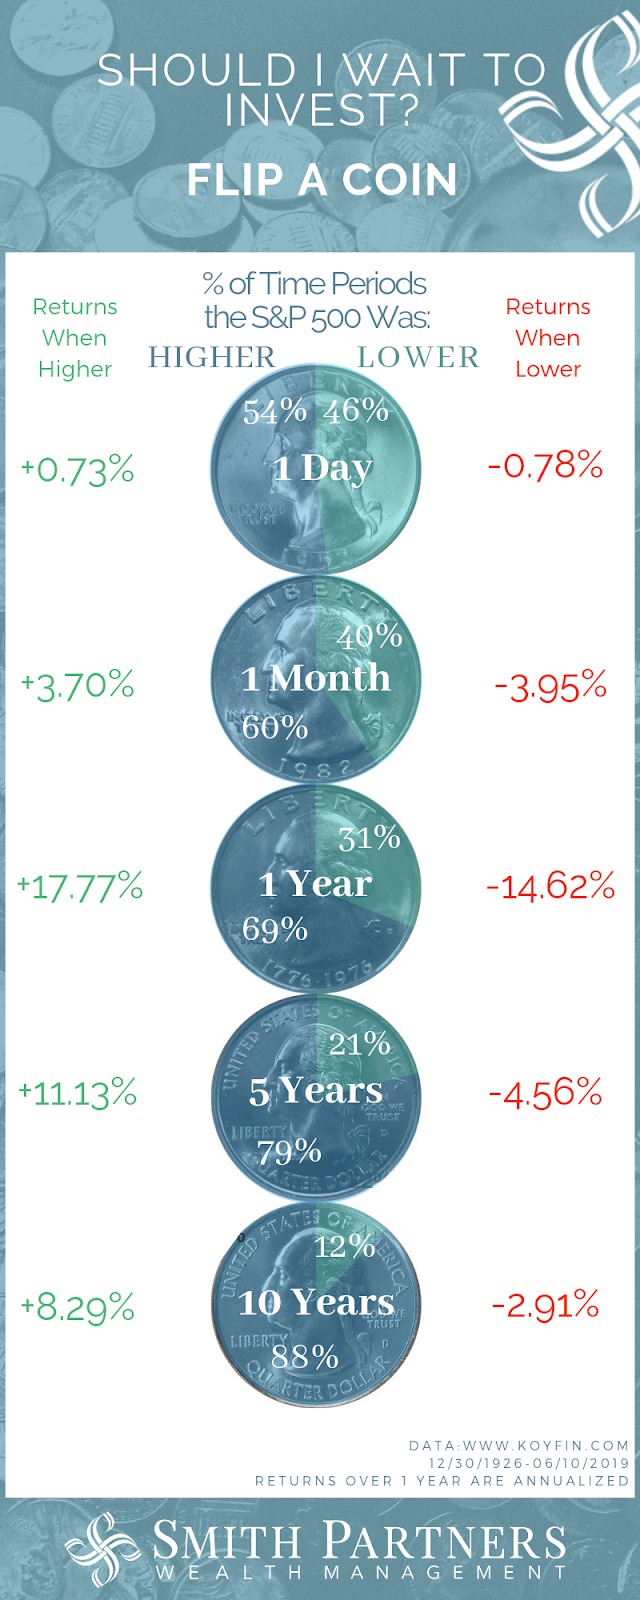
If we look at 1-day returns for the last 93 years, there has been a near “flip of the coin” (54%) chance that we would land on “heads” and the market would be higher the next day (see the numbers within the 1 Day coin in the graphic below.).
On those “heads” flips, the S&P 500 was up an average of +0.73% for the day. When it was a down day, it dropped by a similar -0.78% (see the Green and Red numbers beside the 1 Day coin.)
When we move to the next coin to look at 1-month returns, we find similar results. The investor who said “I’ll wait till next month to invest” ended up kicking themselves 60% of the time because the S&P 500 was higher (more expensive) a month later. On average, the positive months were up +3.70% and the negative months were down -3.95% for the month.
Longer Term: Heads I Win, Tails I Don’t Lose As Much
But as an investor’s time horizon increases, we see two trends that tilt heavily in favor of not waiting to invest.
The first is that as time increases, “heads” was flipped much more frequently. Notice the Blue portion of the coins in the graphic, it gets larger as the time horizon increases.
- The S&P 500 was higher after 69% of the 1 year periods,
- 79% of the 5 year periods and
- 88% of the 10 year periods.
In other words, as an investor lengthens their time in the market, they exchange their “fair” coin (where heads and tails have similar occurrences) for one of those weighted gambler’s coins (where heads, or positive periods of growth, tends to occur much more frequently.)
The second trend is that as the time horizon increases, “heads” experienced a higher magnitude of return in the positive years than in the negative years. Notice the Green and Red numbers for each time horizon:
- Over 5 year time periods, when the market was up (79% of the time), it was up on average +11.13% per year. But when it was down (21% of the time) it was only down -4.56% per year.
- Over 10 year time periods, when the market was up (88% of the time), it was up on average +8.29% per year. But when it is down (12% of the time) it was only down -2.91% per year.
What Would a Human Do?
These models are helpful. But by using them, we make some assumptions that are unrealistic and could be costly to overlook. Namely, we assume that investors don’t have feelings and that investors will stick to a plan.
Investors Don’t Have Feelings: It would be great if investors could make their decision, feel good about it, and then move on with their lives without regret or second-guessing themselves. But we’ve certainly seen this isn’t true. As we mentioned in a recent blog post, we ask new clients about their best and worst financial decisions. The bad decisions are quick to come out and the associated regret is usually evident. It is worth taking into account how an investor handles regret and what it might be worth to identify and avoid it.
Here is where we see that the source of funds plays a larger role. We’ve found that if the funds come from a cash influx, investors can potentially regret a decision from this day forward. But when an investor decides to get back into stocks after a period of missing out on good returns, investor regret is compounded by the months or years of missed opportunity.
Investors Will Stick To Their Plan: In the models above, we also assumed that the investors would stay invested or diligently dollar cost average. They wouldn’t change their decision when the news turned bleak or their brother-in-law told them they made the wrong choice. We’ve read the research and seen it in person that this isn’t true (see the colored bars below.)
For the Lump Sum option to work, those assets need to stay invested over the course of time; which can be very challenging. But for the DCA method to even hope to keep up, the investor will need to have the courage and discipline to a) buy into a more expensive market as it goes up and b) buy into a scary market as it goes down.
It might seem unrealistic to show the impact of waiting 5 or 10 years to invest. Does anyone really plan on sitting out of the market that long? No, they don’t plan on it. They plan on sitting out until “the worst is over” or “we’ve reached a bottom.” They fail to remember what the headlines look like at the bottom or what uncertainty feels like while waiting for the next shoe to drop.
Exploring Alternate Realities
I earned a lot of “Dad points” recently when I told my 11-year-old daughter that I used an “Avengers: Endgame” analogy with a client couple. Just like the Ancient One explained to Hulk/Banner, whenever we make a financial decision, we’re choosing to go down a certain path. But we’re also choosing to close the door on a number of other “alternate realities.”
For the person deciding between lump sum investing (“today”) or dollar cost averaging (“tomorrow, next month, next year, etc”), they have to reconcile the math and the emotion of their choice with the probability that they will stick to the plan. So whenever we are processing a choice with clients, we intently ask and attempt to answer the question for each option: “When are we going to kick ourselves?” or in my Avenger’s language, “Which alternate realities are we going to choose not to live in?”
As we’ve seen from the math above, there aren’t many people who could convince us that the math says they should dollar cost average into stocks over long periods of time. But if someone can afford to miss out on some higher investment returns AND has a compelling reason why that choice would be emotionally/behaviorally helpful to them, then it might be the best possible plan for them. It comes down to being informed about the possible “alternate realities” and when an investor might kick themselves, before choosing a best path forward.


