Quarter in Charts – Q4 2022
It’s hard to describe how rare and painful 2022 was for investors of all kinds. The phrase “off the charts” is often overused, but in this case, it seems appropriate. And while we’ll look at the causes and details of this year’s returns, we’ll also spend some time exploring how investors should consider viewing the coming years.

After factoring in lost purchasing power from inflation (i.e., Real Returns,) we see that Bonds retreated more than 30%, and stocks lost nearly 25% of their value. That little red dot (chart above) looks as out of place as most investors feel. Risk-taking investors certainly don’t welcome stock returns like this, but risk-averse or moderate investors likely never imagined that both stocks and bonds could fall in lockstep so dramatically.
To put it in context (and to update a chart from the Q3 2022 Quarter in Charts), the 60% Stock/ 40% Bond portfolio experienced its 3rd worst year since 1928, returning -17.5%. This decline resulted from the worst year ever for US Treasuries and the 7th worst year for US Stocks since 1928.

The bond markets rallied a bit in the fourth quarter but still ended the year with losses across the board, concentrated heavily in longer-term bonds which are most impacted by rising interest rates. Now that bonds are starting to keep pace with slowing inflation, they will likely begin to act like themselves again, a place of refuge when equities turn south. Even though the Fed will likely continue to increase interest rates to further slow inflation, the market is pricing in increases in February and March. In other words, bond investors shouldn’t feel the sting of those rate increases (unless they are heftier than the market is already anticipating.)

- Worst Year Ever https://www.morningstar.com/articles/1131179/15-charts-explaining-an-extreme-year-for-investors
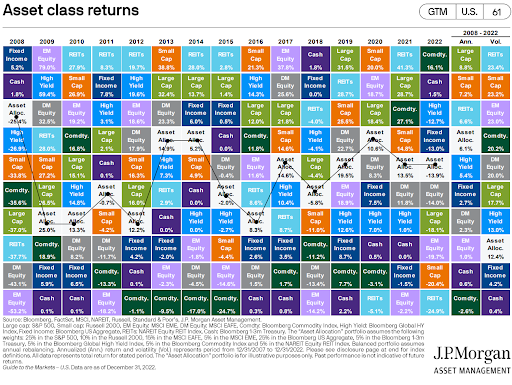
But the pain reached beyond just large US stocks, Bonds, and Treasuries to all areas of the bond markets, foreign stocks, and real estate as shown below.

Investors had to look hard to find good returns in 2022. In fact, the only major asset classes that had positive returns were commodities and cash (above)…and the average portfolio of members of Congress (below, compiled based on reported trades), which we’ll leave without comment.

Recession
To put the brakes on inflation, the Fed has taken dramatic (though what seems like late) corrective action in increasing interest rates. The yield curve is decidedly inverted (10-year yields are lower than 3-month yields), which is a fairly accurate recession predictor, as we can see in the charts below from the Federal Reserve Bank of New York.

We’ve already started to see the impacts of higher interest rates and recession fears begin to flow through the housing market, the car market, and the stock market. Interestingly, we’re still hovering around a historically low unemployment rate, which almost always bottoms out before, and rises throughout a recession.

On the individual consumer front, of particular concern are the dwindling savings and discretionary spending of the average American household. Taking a look at the Personal Savings Rate, we see two congruent trends: long term societal trends in decreasing savings (to increase consumption), but more recently we see a sharp decline due to wage growth not keeping up with inflation, rising interest rates, and removal of COVID stimulus.

Living Through a Recession
If we are in a recession and are wondering how we’ll make it to the other side, we need to know two things: recessions shouldn’t surprise us and investor success doesn’t depend on avoiding them. In fact, recessions play a large part in great long-term returns for stocks (and dependable long-term price consistency for bonds), just like economic expansion also plays a part.

Recessions (and the possibility of entering or exiting one) fuels much of the fluctuation in stock prices. In the last 70+ years, average S&P 500 returns have rarely produced “average” years. As seen above, the S&P 500 has grown at an average of 9.1% annually since 1950. But actual calendar year returns paint a different story. As Ryan Detrick points out, we’ve only experienced four calendar years with returns in the 8-10% range (which is only 5.5% of the time.) 94.5% of the last 70+ years, investors have gained or lost at a rate far different than “average.”
We don’t know how we’ll return to the peak of January 2022, but if history is any guide, we are likely to do so. And if that happens, we could expect some pretty attractive investment returns even if that takes another 4 or 5 years (see below, left.) We know the path back to market highs won’t be a straight line and could continue further downward before it turns around. But unless an investor is going to have the insight and conviction to increase their risk at that lower point (when the headlines are likely worse than today,) the better option seems to be to wait out the rebound.

So, what are we to expect if it isn’t wise (and hardly possible) to try to side-step recessions? It can be helpful to see the exact opposite scenario. What would an investor’s return look like if they had bad timing and started investing right at the beginning of each recession?
We can see below that their 1-year returns would be lower than average (but still above bond returns), but then their 3 and 5-year returns would be nearly indistinguishable from the average stock returns. Recessions certainly hit business owners, consumers, and employees hard in terms of net profit, excess spending and potential layoffs. But there’s hardly evidence for prolonged pain for equity or bond investors other than momentary fluctuation in asset prices that tend to correct themselves fairly quickly.

What if we imagined a world where stock prices didn’t oscillate as much. Rather, they came with a level of guarantee. We would no longer call those assets stocks, instead we would call them bonds; and they have lower investment returns. Similarly, imagine that bonds weren’t so volatile and subject to interest rate or default risk. We would no longer call them bonds, rather, we would call them cash. Investors know this principal in theory: no risk, no reward. However, many investors forget it in practice.

The inherent nature of risk and return among asset classes is why it is essential to have a financial plan, not just an investment portfolio and vice versa. A financial plan with no portfolio strategy is like planning a trip and saying, “I’ll research the currency when I get there.” Alternatively, a portfolio without an intentional financial plan is like buying up currencies before I know where I’m going.
If we’re going on a short-term trip, we should own short-term currency (bonds and cash.) If we’re going on a long-term trip, we need long-term currency (US and Foreign Stocks.) We’ll still have outlier years like 2022 where bonds did not act like a short-term currency, and that is hard to stomach. But if we stack the odds in our favor and adjust as needed, we face a much higher likelihood of having the currency we need when we arrive at our destination.


Justin Smith
Latest posts by Justin Smith (see all)
- Tariffs and a Declaration of Parental Independence - April 11, 2025
- Quarter in Charts – Q1 2025 - April 11, 2025
- Quarter in Charts – Q4 2024 - January 22, 2025