Quarter In Charts – Q4 2019
It’s interesting to think about what an impact Julius Caesar had on the calendar and from that, our lives. I remember when I started at Smith Partners Wealth Management (then Jonathan Smith & Co.) in 2005. The great Legg Mason Value Trust mutual fund manager Bill Miller was in the middle of his 15th consecutive year beating the S&P 500 index. Miller’s streak was unprecedented. He was on the cover of every financial magazine and money flowed into the fund.
I remember, as a young associate, putting together a spreadsheet of monthly returns to figure how long the streak would have lasted if Julius Caesar had started the calendar year in any of the other 11 months. While the long term returns would have been the same (and still impressive) in some cases, the streak would have only lasted 2 or 3 years! But even Miller knew that Caesar had something to do with it-
“As for the so-called streak, that’s an accident of the calendar. If the year ended on different months, it wouldn’t be there, and at some point, those mathematics will hit us. We’ve been lucky. Well, maybe it’s not 100% luck. Maybe 95% luck.”
Bill Miller, WSJ
Fast forward to today. After experiencing a -20% market selloff that bottomed just as we were turning over our calendars last year (December 24th, 2018) many investors experienced an interesting year in the midst of an unprecedented decade.
Where Did the Returns Come From?
As I mentioned in an October 2016 blog post before the last presidential election (which, incidentally, has some pretty good advice for this upcoming election), equity returns are the product of company earnings, dividends, and change in the multiple (P/E ratio):
Dividend Yield + Change in Price to Earnings (P/E) Multiple + Earnings Growth = Investment Return
The tale of the tape between 2018 and 2019 (chart below) is a prime example of the stark contrast between investors’ willingness to pay a higher Price to Earnings “P/E” multiple (represented by the grey bar) versus real company earnings (dark blue.) We see that earnings were higher in 2018, but the decrease in multiple was the main reason for poor returns. Conversely, while dividends (light blue) were higher in 2019, earnings growth slowed, and multiple expansion accounted for the vast majority of investor return.
When we look at the US versus Foreign equity (stock) returns, we can see in the chart below how they have generally moved with some degree of correlation over the last 20 years. As the Tech Bubble ramped up in the late 1990s, US stocks outperformed, but in the ensuing downturn, they moved in lockstep. Coming off the bottom of the 2003 bear market, Foreign equities gained twice what US stocks experienced until they again fell and rose in lockstep through 2012.
However, for the last 7 years, US equities have outperformed non-US stocks by a wide margin on the backs of both earnings growth and multiple expansion. Non-US stocks have typically sold for lower P/Es than US stocks and have also historically paid a higher dividend yield. This is similar to houses in one part of town selling for more per square foot (or being able to charge more for rent) than in another, less desirable neighborhood.
While this difference makes sense, we still want to pay attention to the direction and magnitude of the gap between these asset classes. When compared to the US, if 1) foreign dividends are higher and 2) foreign equities’ multiples (P/E) have more room to expand, that could account for two of our three variables in the investment return equation mentioned above.
Time Horizon is Everything
Rob Arnott, Chairman of Research Affiliates, puts the P/E ratio in good perspective in the charts below. He points out that over any time horizon when the P/E is higher (cyclically adjusted PE or CAPE in this case) future returns tend to be lower (you can see the yellow line slopes down, indicating that investment returns decrease as CAPE increases.)
However, in the short term (Panel A), there is little predictive confidence between the two factors. As the time horizon increases, the band of outcomes tightens. In other words, if I have time, I should probably pay more attention to valuation. If I don’t have time, I should probably pay more attention to my particular situation (more on that later.)
Put differently, Arnott shows the relation between the P/E and subsequent 10-year returns. While they don’t exactly move in lockstep, one can see with a current CAPE of 30.87; there’s plenty of reason to pay attention to the valuations today when thinking about 10+ years down the road. (See Arnott’s full presentation here.)
What’s an Investor to Do?
Over the last 15 years, I’ve had a hand in writing, researching, or proofreading 60 quarterly market commentaries, and I must admit that our “what’s next” sounds eerily similar in most of them. In our commentary a year ago, we couldn’t have predicted that we would endure the US’s longest government shutdown, experience two -6% market drops, get into a trade war with China, and exchange missiles with Iran…and still see appreciating markets across all asset classes.
Our best advice: Be more aware of what is going on in your life, and less aware of what is going on outside your life.
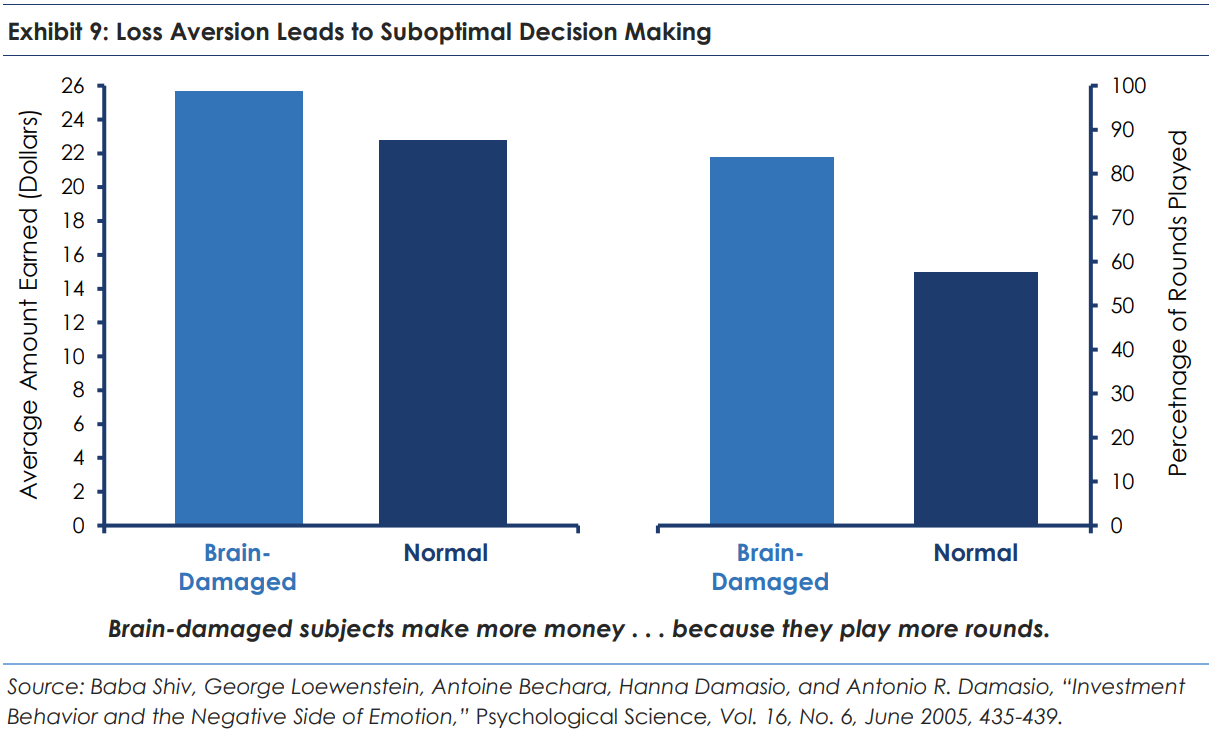
In his white paper “Who is On The Other Side,” Blue Mountain Capital Management’s Michael Mauboussin highlights a research paper that studied the betting behavior of two groups: one group had brain damage and one group had ordinary participants. The game they played was the opposite of casino games, because it heavily favored the players instead of the house (i.e. the more they played, the more they could expect to win.)
The researchers found that the participants with brain damage won more money, simply because they played more. The ordinary players would tend to quit after they lost a round while the brain-damaged players continued playing, because they didn’t let the sting of a loss overpower the math of the game.
In investing, the “players” (investors) have typically been rewarded for “playing” more rounds (or staying invested) versus cashing out after a losing round. The exception to this is captured in the first part of our advice “be more aware of what is going on in your life.” Even if the odds are in an investor’s favor, it can still make sense to pay off a mortgage, build up an emergency fund, pay for a car outright, give away a sizeable charitable contribution, or take on less risk as we get closer to retirement.
In the research example, the brian-damaged players had no other reason to play except to accumulate more (with what likely felt like “house money.”) However, when we’re investing hard-earned dollars in hopes of accomplishing well-defined goals, the investment plan needs to move in step with (and be informed by) much more than our feelings and the most recent headlines.


