Most Stocks Underperform Treasuries…and Santa’s Not Real
Dr. Hendrick Bessembinder is shattering stock pickers’ dreams like the 2nd grader who tells his classmates the truth about Santa Claus. Looking back over an 89 year period (1926-2015), the Arizona State professor found that the odds of picking winning stocks are not that appealing. In fact, investors would have a better chance at picking a losing stock than a winning stock.
I discovered Dr. Bessembinder’s research through a blog post by Wes Gray, PhD CEO of Alpha Architect who found it shocking enough to annotate the abstract with phrases like “Uggg”, “D’oh!” and “Stop the pain!” You can read through the whole academic paper here.
And the winner is…
Assuming I picked a random month over the last 89 years, and then picked a random stock, Bessembinder shows that I would have a 47.7% probability of picking a stock that would outperform the one-month Treasury (extremely low risk bond type investment) over the next month.
This seems preposterous considering $100 invested in 1928 would have grown to $328,645.87 if invested in stocks (a 9.5% average annualized return) but only $1,988.00 if invested in Treasuries (a 3.4% average annualized return.) (For more detailed information on annual returns, see Aswath Damodaran’s data here.)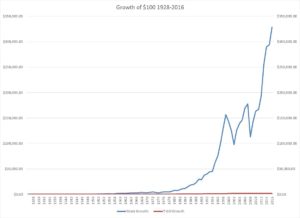
The key difference is that Bessembinder’s research centers on picking a winning individual stock rather than investing in a broad stock market index. The massive returns we see above ($328, 000 vs $1,900) are due to a handful (and I mean a handful) of stocks providing a large part of the return.
“So you’re telling me there’s a chance”
In Dumb and Dumber, Jim Carrey’s character, Lloyd Christmas, asks his love interest what the chances are of them ending up together. She’s hesitant to hurt his feeling, but when Lloyd asks her if it is one out of a hundred, she feels the need to clarify downward: “I’d say more like one out of a million,” she says, sure that it will crush him. Lloyd pauses, then famously responds: “So you’re telling me there’s a chance!”
That hypothetical $328,000 in wealth created since 1928 was a team effort for sure; a team of roughly 26,000 stocks in fact. While the timelines don’t line up exactly (the research paper is 1926-2015 while the returns stated above are 1928-2016), the fascinating part of this research is that of those 26,000 stocks:
- The top performing 5 stocks (Exxon, Apple, GE, Microsoft, and IBM to be specific) would have accounted for roughly $33,000 (10.28%) of the total $328,000 return.
- The top 86 stocks would have accounted for roughly $164,000 (50%) of the total return.
- The top 282 stocks would account for $246,000 (75%) of the total return.
- The top 983 stocks would account for $328,000 (100% of the total return.
- Meaning the other 25,000+ stocks would net out to add $0.00 to the return. Some would have a mildly positive return over their lifetime, some would have a negative return, but they would cancel each other out.
Yes, you read that right, 5 stocks (1 out of 5,000 stocks) accounted for 10% of the returns and 86 stocks (1 in 300 stocks) accounted for 50% of all returns. (Thanks to John Rekenthaler at Morningstar for pointing out some of these percentages.)
Two Portfolios Diverge
Seen another way, while there are multiple paths which could have earned 9.5% average annual returns and turned $100 into $328,000 over nearly 90 years, there are two paths in particular that stand out to me. An investor could either:
- Own all 26,000 US Stocks within an index and never think about which ones to buy and sell or,
- Skillfully pick the top 983 (the best 4 out of every 100 companies) while avoiding the other 25,000+ stocks (the other 96 out of 100 companies).
For us, this screams the need to diversify and makes a compelling argument to having index funds be the core to an investor’s portfolio. But hey, just like Lloyd Christmas, there’s always a chance.


