Quarter in Charts – Q4 2022

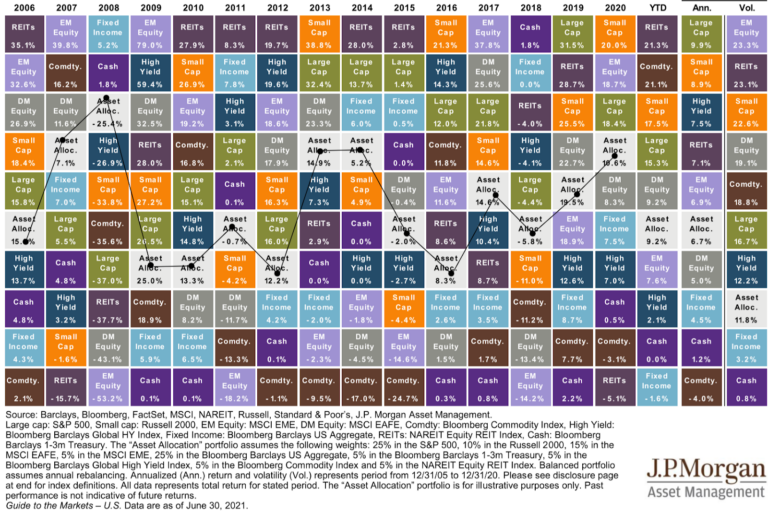
It’s hard to describe how rare and painful 2022 was for investors of all kinds. The phrase “off the charts” is often overused, but in this case, it seems appropriate. And while we’ll look at the causes and details of this year’s returns, we’ll also spend some time exploring how investors should consider viewing the

Quarter in Charts – Q2 2022

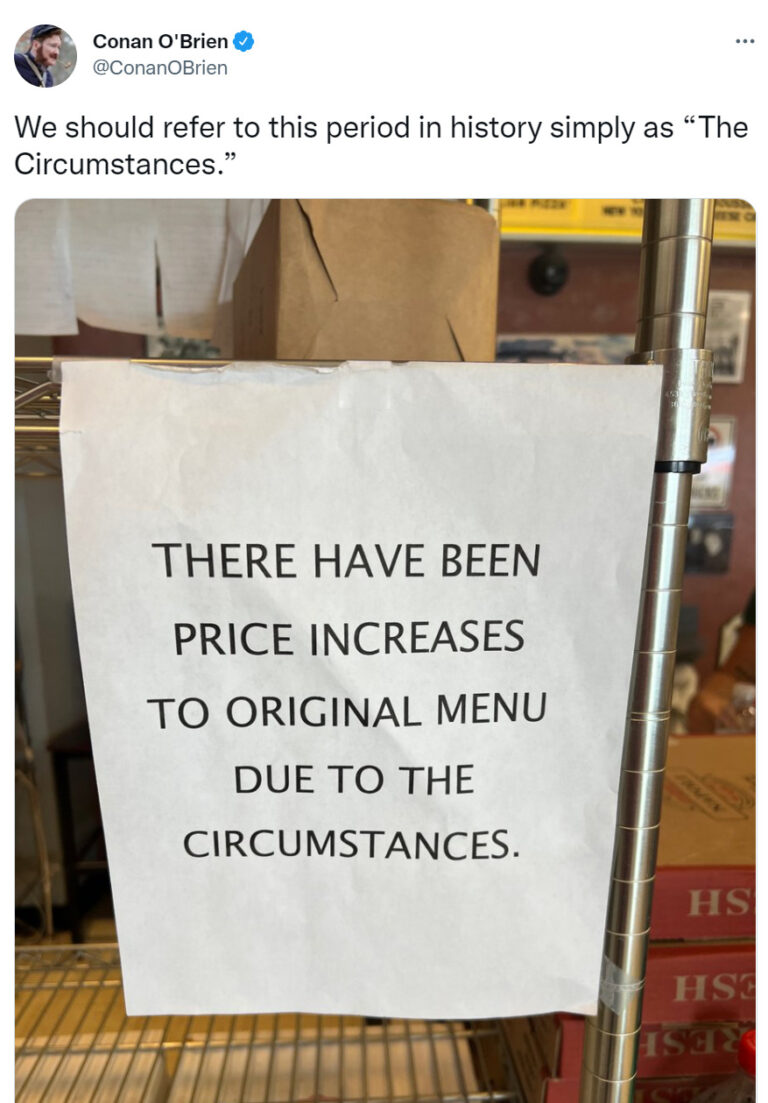
“The Circumstances” So far this year, investors have experienced a dramatic increase in interest rates and sustained high inflation, coupled with a decrease in both stock and bond prices not seen in half a century. All of this while the US continued to add jobs and public companies increased profits at a steady pace. Below

Quarter in Charts – Q4 2021

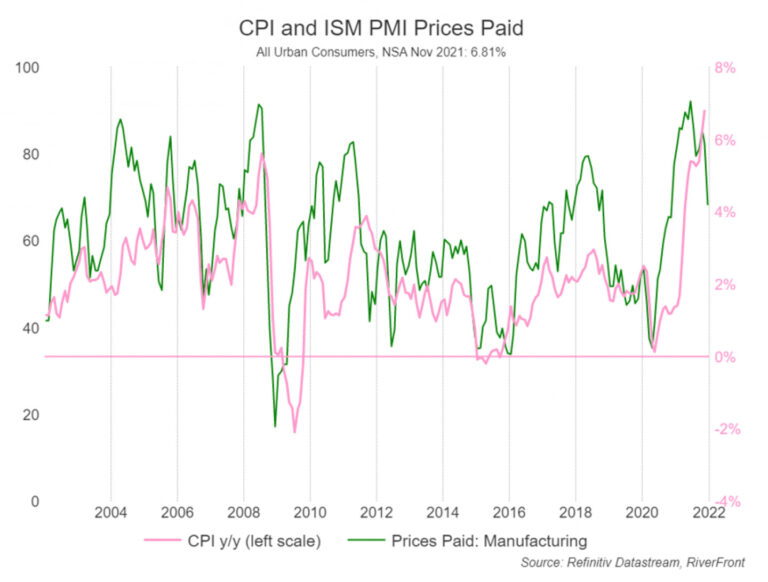
Rising prices seem to be at the top of everyone’s mind. From Social Security recipients wondering if the cost of living adjustments will keep up their actual expenses, businesses and employees wondering how to factor in wage increases, or everyday consumers struggling to keep their energy and food costs under wraps. Congress even joined in with concerns. Last week at the Senate Banking Committee meeting, Federal Reserve Chairman Jerome Powell told lawmakers,

Quarter in Charts – Q2 2020

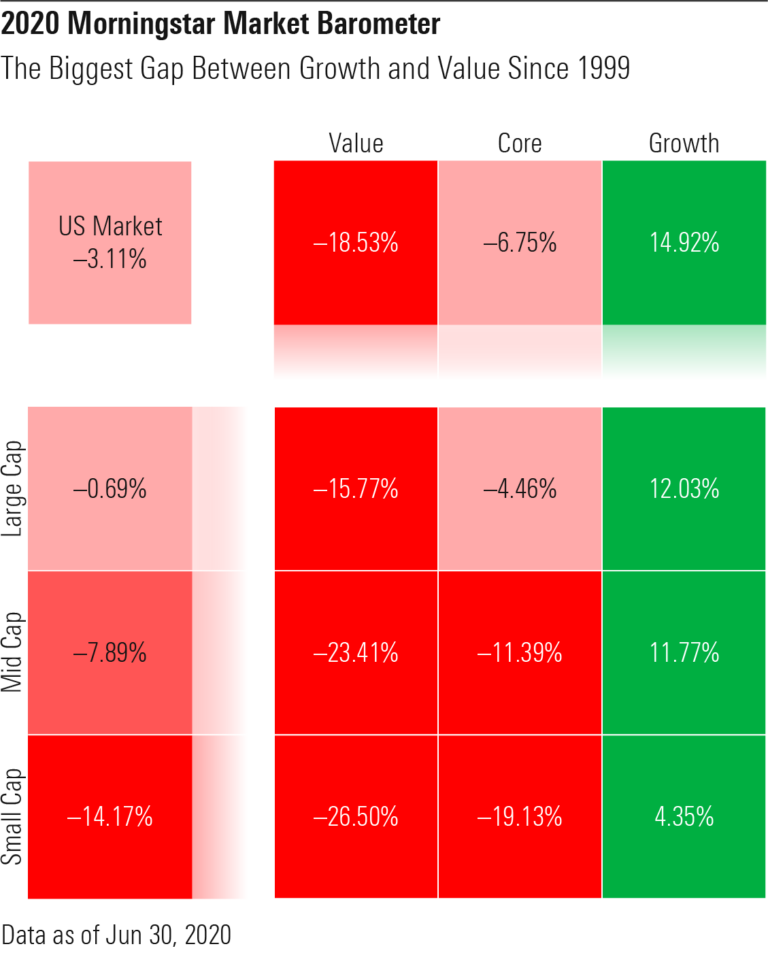
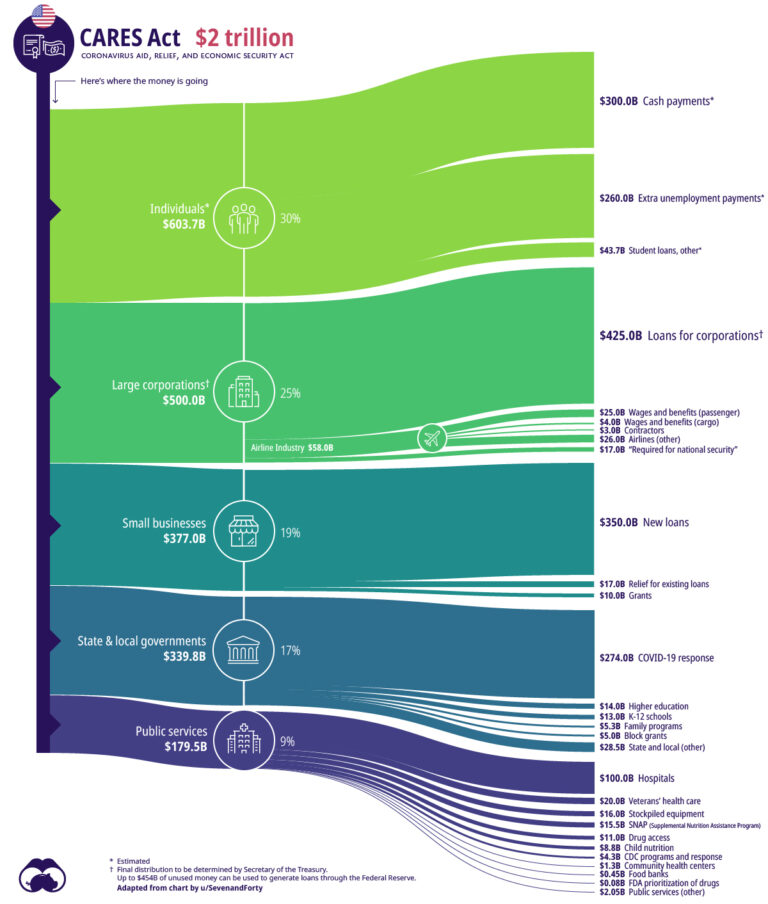
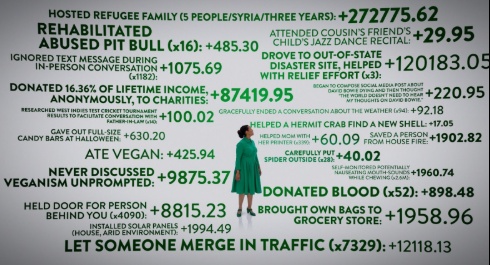
So, How Was Your Day? Your Quarter? Your Year? It’s hard to wrap my mind around the wildly different experiences we’ve all had over the last four months. For every quarantined person who has learned to bake sourdough, many more kids aren’t getting their school lunches. For anyone who has realized they can do their

Quarter in Charts – Q1 2020

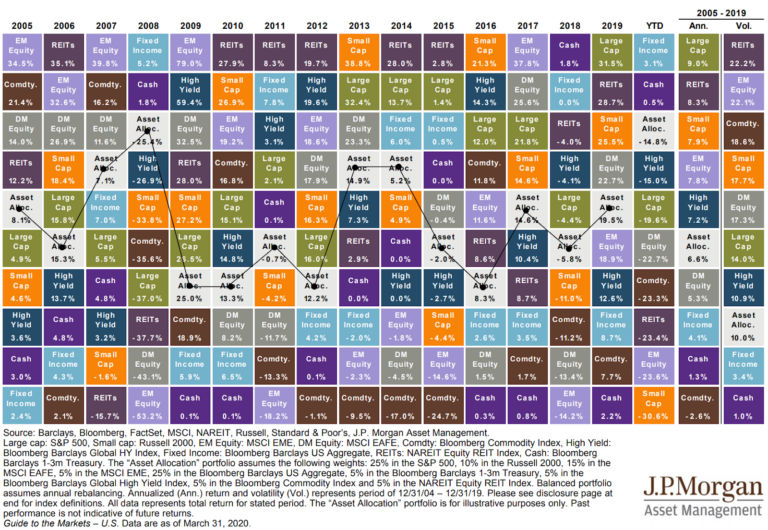
From an economic and investment perspective, saying that the first quarter (particularly March), was without precedent is an understatement. Investors experienced the fastest bear market (from Peak to -20%) ever recorded in US stocks.  But it wasn’t just down days that we experienced; we had plenty of dramatic positive days as well. As Nick Maggiulli