Market Commentary Q2 – 2015
Grinding Like a Garden Tiller
The human brain works nonstop trying to figure out what the eye sees. It’s been working overtime trying to figure this one out: over the last year, the Dow has gone up one percent and down one percent 53 times. Over this time, it traveled 42,823.56 points up and down, and for all its churning, the Dow’s up 3 percent. But we see the probabilities as better than even that this grinding sideways market will keep on grinding, sideways up a little, sideways down a little, like a garden tiller grinding hard ground. If a sideways grinding market is not the sort of thing you pay attention to, you’re much better off.
Lest we forget how the market came to be at an all-time high grinding sideways, here’s a refresher. The Fed, responding to the financial meltdown of 2008, pumped mountains of money into the banking system. Opinions differ as to whether the Fed responded or reacted, but that’s neither here nor there. This wasn’t the only time the Fed cranked up the money pump, either. During the six years that followed, the Fed purchased $3.5 trillion U.S. Treasury and Mortgage Backed Securities (QE1, QE2 and QE3). By taking higher yielding Federal securities out of circulation and replacing those securities with new dollar bills, the Fed pumped money into a sick U.S. economy until, in the Fed’s judgment, the patient was well enough to walk out of the hospital under his own steam. However, these newly pumped dollars weren’t earning interest, per se, and so whoever held them had to go find a decent replacement return, otherwise inflation would start dinging away making
those dollars worth less. So they did, and the market went up 200%. People felt richer, companies felt richer and some people really were richer, but not many middle class folks and surely not lower class folks. And as the market rose, future expected stock returns hit the ground like the heavy end of a seesaw. Thud. Remember the see-saw; it holds the key to sustainable investment returns.
The relationship between cash and equity markets is worth understanding. First, the Fed keeps track of all cash in America and its ebbs and flows. At the present, there’s $11 trillion of cash in America (not that anyone’s counting, but there was $9.345 trillion on March 9, 2009). The beauty of cash is its totally liquid, it can go anywhere, anytime and its market risk is ZERO…but right now it’s earning ZERO. It has but one known predator: inflation. The proportion of all cash on March 9, 2009, (think all the savings passbooks, CDs and Money Market accounts in America) to the total market capitalization (the combined stock market value of every publicly traded company in America) was 1.54. Meaning that on the lowest day of the worst recession since the Great Depression, for each $100 worth of stock market value, there was $154 in cash ready to bail out a seller.

Fast forward to today. For every $100 worth of market value, there’s only $50 in passbook savings, CDs, etc. This ratio seems stretched mighty thin (it shrunk from 1.54 to 0.50). But, and this is important, that ratio’s been 24% thinner, all the way down to 0.38 to be exact. In addition, it has hovered a bit higher than where it is now for four years. We’re not predicting that the market (the numerator) will go higher or that all this cash (the denominator) will go lower, pushing the ratio back down to historic low. We’re only suggesting that the ratio has been lower and if it tested the lower range of mean-reversion history, it would go lower and this grinding might drag on for another year to year and a half and, quite possibly, take the market higher.
How Do Bull Markets Die?
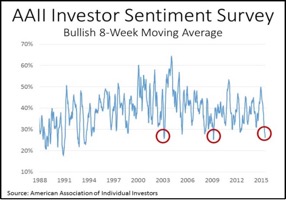
The leading causes of death to a Bull Market are two: euphoria and recession. Investors today are complacent, and they have been for over a year, but they’re nowhere near euphoric. According to AAII, low levels of bullish (optimistic) investor sentiment are contrary indicators associated with rising, not falling, stock markets. Meaning, when there aren’t many investors who think the market will go up, it actually tends to go up. And while AAII’s polling method isn’t totally scientific, recent bullish market sentiment is at low levels associated with capitulation and panic bottoms, as shown above.
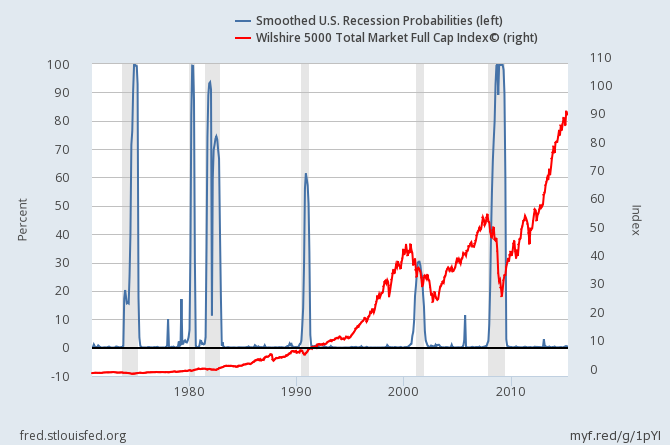
Recession probabilities, as produced by the Federal Reserve Bank of St. Louis are low, as shown to left. Regardless what the headlines say (China, Greece, Iran or four hour stock market blackouts) when we examine the evidence, we see an improving US economy, and expanding workforce and a consumer who’s still demanding goods and services.
It’s Been Said
Jeremy Grantham, chief investment strategist of Grantham Mayo Van Otterloo (GMO), a Boston-based asset management firm having $118 billion in assets under management as of March 2015, and particularly noted for his prediction of financial bubbles, presented at Morningstar’s Investor Conference a
few weeks ago. About the current stock market, Grantham stated, “No bubble yet…but close. Another five to ten percent appreciation would put the market in bubble territory, but that doesn’t mean it will pop right away. So I think it feels like a year or two to go, plenty of room for higher prices, plenty of room for more speculation, and I think that will happen, possibly by the election or possibly afterward. And then we’ll be followed by the third Greenspan-era break of, I would guess, probably close to 50% once again (he’s quite a vocal critic of governmental responses to the Global Financial Crisis) initiated by some unknowable (emphasis mine), final pin.” When asked what to do with this market Grantham sagely advised, “Act prudently and just recognize that you may have to bite your lip quite a while as a value manager watching the market go higher. And that’s really a part of my job, trying to explain to people that even though the market is very overpriced, that will not necessarily stop it torturing you to death, or half to death.”
Homegrown Alpha
While neither we nor our clients feel as though we’re being tortured to death (or half to death) by a very overvalued market going higher, a longtime friend of ours demonstrated an ingenious and tangible way to “add” to her bottom line simply by saying no to an ordinary discretionary expense. In the investment world,
alpha is the term for the excess risk-adjusted return of an asset relative to the return of an asset’s benchmark, but we think alpha belongs in a broader category than just investing.
Our friend gave our daughter and her husband a gem of a baby blanket for their newest son, Sawyer James North. Over the last nine years, she’d knitted each of our five older grandchildren their own baby blankets, five labors of love. However, by the time number six arrived, she decided there must be a better way than buying goodness knows how many more skeins of yarn. Her process, she said, was to knit smaller patchwork squares from the 35 unique remnants left over from previous five blankets and then piecing them all together. Someday when Sawyer is old enough, his parents will hand down the story about how his benefactor reallocated leftover yarn ends into an heirloom without ever spending a dime.
Our job is to help our clients create alpha by whatever means necessary and prudent. Since we’re fee-only fiduciaries, our clients know us well enough to know we’re agnostic about where we get that alpha. Most of the time, it is in the form of asset appreciation, interest, and dividends. But many “alphas” take the form of talking through a cash flow plan, suggesting tax minimizing strategies like Roth conversions and gifting appreciated stock, or sitting down to look at difference social security strategies. And often, that alpha comes from encouraging a client to have an honest conversation with their kids about college costs, accompanying them to a meeting with their estate planning attorney or talking about where they want to spend their time volunteering. In the end, all of these sources of “alpha” are as real a return “earned” as arranging leftover yarn into a newborn’s gift.
Building, protecting, and managing wealth through every stage of life. Our comments about the economy and the stock market are based on our own analysis and are not representative of the future performance of any security, fund or of the overall market. Any discussion of specific securities is provided for informational purposes only and should not be deemed as a recommendation to buy or sell.
