Quarter in Charts – Q4 2024
| |

Quarter in Charts – Q4 2024

When we consider the possible variations within a financial plan (investment markets, job changes, health concerns, family dynamics, etc.), we like to say, “It’s better to prepare than to predict.” It would be hard to find a year that defied predictions more than 2025. In the most recent update to his Annual Forecasting Follies, Bob…

Presidents and Markets
| | | | | |

Quarter in Charts – Q3 2024

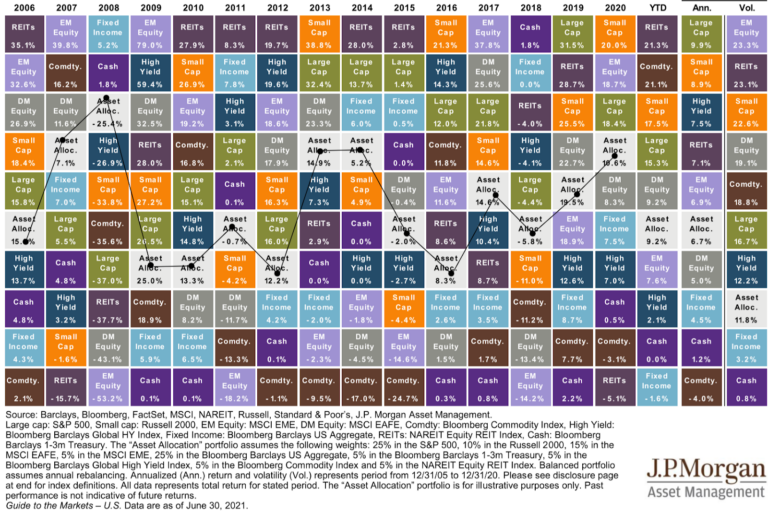
2024 is shaping up to be one of the rare years with no major asset class in decline (see far right column in the chart below.) Large Cap US, Foreign Stocks, and Real Estate have led the way, while Bonds and Commodities have returns barely more than money markets. Below, we will detail the relevant…

Quarter in Charts – Q4 2023
| | |

Quarter in Charts – Q4 2023

Happy Adjacent I recently learned the term “Happy Adjacent” when I stumbled on a YouTube series from Mythical Kitchen called “Last Meals.” The episodes center on Chef Josh Scherer asking famous people (some more famous than others) what they would eat for their last meal on Earth. Josh then recreates the meal, and they sit…

Quarter in Charts – Q3 2023
| |

Quarter in Charts – Q3 2023

In this Quarter in Charts, we have several graphs detailing the current interest rate environment, global market events, the bond bear market, and various economic indicators. We use this data to explain what happened (and look ahead to what could happen) in economies, markets, and investment portfolios.  But none of those graphs will be able…

Quarter In Charts – Q1 2023
| | | | |

Quarter In Charts – Q1 2023

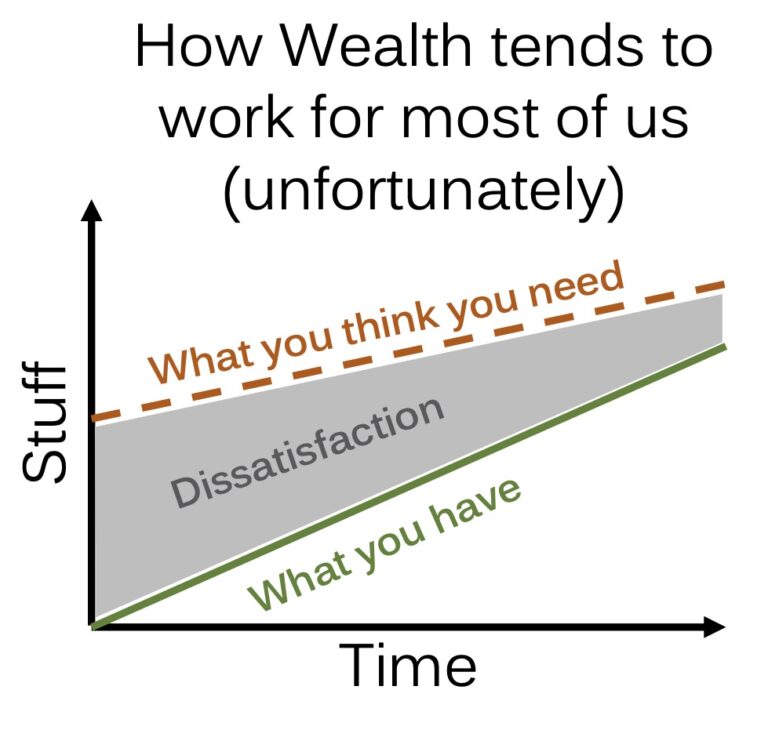
Kids Today Have It Too Easy As a dad of teenagers, it’s my duty to occasionally put on the “grumpy old man” act and talk about how kids today have it too easy. I say things like, “You know when I was a boy…” followed by a misremembered anecdote of my days working at the…

Quarter in Charts – Q3 2022
| | | |

Quarter in Charts – Q3 2022

Over the last few weeks, I kept the kids up far past their bedtimes to witness Aaron Judge break the American League single-season home run record. While we had to sit through a whole lot of walks, we eventually got to witness a once-in-a-lifetime event that we’ll tell some grandkids about. Sadly, this year, investors have also witnessed an investment market for the record books. Through the charts below (and a recounting of my real-world experience with our 15-year-old new driver) we’ll examine the year so far, talk through viewing investments through the “windshield” of a financial plan, and see how investors have typically fared better than average coming out of historic times like these. 

Quarter in Charts – Q2 2022
| | | | | |

Quarter in Charts – Q2 2022

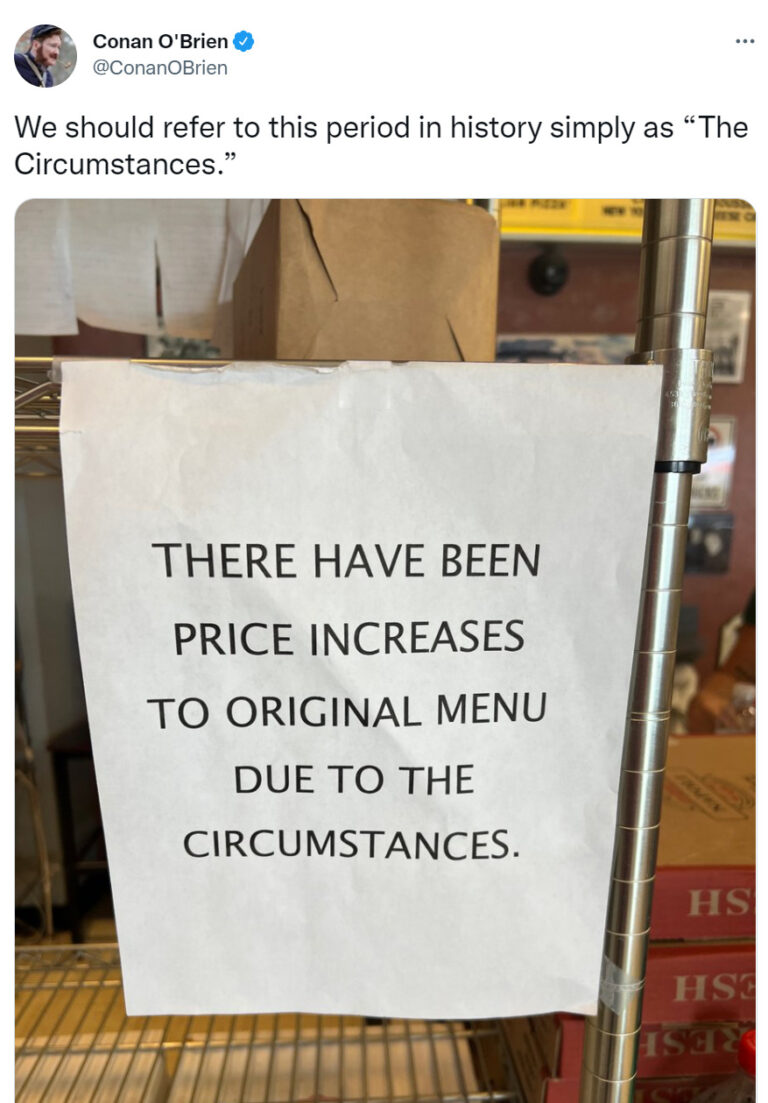
“The Circumstances” So far this year, investors have experienced a dramatic increase in interest rates and sustained high inflation, coupled with a decrease in both stock and bond prices not seen in half a century. All of this while the US continued to add jobs and public companies increased profits at a steady pace. Below…

Quarter In Charts – Q1 2022
| |

Quarter In Charts – Q1 2022

We just completed Science Fair season in our house – whew! Finley (age 12) tested different ratios of Corn Syrup to Sugar to determine the optimal recipe for homemade marshmallows (I take all the credit for the title: “Who Wants S’more Marshmallows?”) Going into the project, she had no idea which recipe would make the…

Quarter in Charts – Q4 2021
| |

Quarter in Charts – Q4 2021

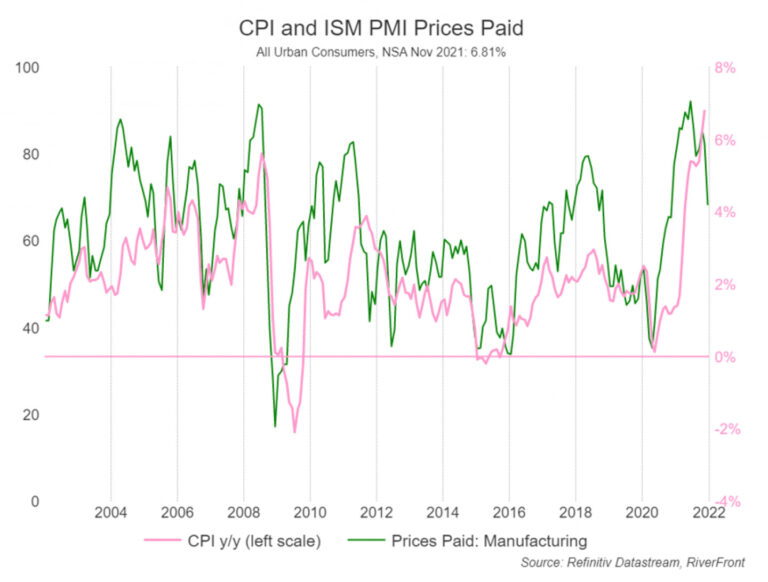
Rising prices seem to be at the top of everyone’s mind. From Social Security recipients wondering if the cost of living adjustments will keep up their actual expenses, businesses and employees wondering how to factor in wage increases, or everyday consumers struggling to keep their energy and food costs under wraps. Congress even joined in with concerns. Last week at the Senate Banking Committee meeting, Federal Reserve Chairman Jerome Powell told lawmakers,